
How to Read Salesforce Apex Debug Logs (Step by Step)
To read a Salesforce Apex debug log: enable a trace flag in Setup → Debug Logs, run the action you want to trace, open the newest log, find the EXECUTION_STARTED boundary, then follow CODE_UNIT_STARTED events to see which triggers, classes and flows ran, and search for EXCEPTION_THROWN or LIMIT_USAGE_FOR_NS to find failures.
Step 1: Enable a trace flag
Salesforce only writes debug logs while an active trace flag exists for the user being traced. In Setup, search Debug Logs → New under User Trace Flags, pick the user, a time window, and a debug level. Two gotchas:
- Trace flags expire; a "why is no log generating?" mystery is almost always an expired flag.
- The debug level decides what the log contains. Too low and your clue isn't logged; too high and the log truncates.
Why no log was generated
This is the most common blocker, and it is almost never the code. Work through these in order:
- The trace flag expired. Flags are time-boxed and silently stop working when the window closes. Check the expiry, not just that a flag exists.
- You traced the wrong user. A log is written for the user whose action triggered execution. If a Process Builder, scheduled job, or integration user performed the DML, tracing yourself produces nothing. For integrations, trace the API user.
- The org hit its log allocation. Salesforce caps total retained debug logs at 1,000 MB. Once full, you cannot add or edit trace flags until logs are deleted, and the failure is not obvious from the Setup UI.
- Trace flags were auto-disabled. Generating more than 1,000 MB of logs in a 15-minute window disables your trace flags automatically. Verbose logging on a busy production org triggers this quickly.
- The log expired before you opened it. System debug logs are retained for 24 hours; logs from monitoring are kept seven days. A Friday afternoon bug investigated on Monday has no log left.
The 1,000 MB ceiling deserves attention on shared sandboxes, where several developers each leave verbose trace flags running. One person's FINEST trace on an active user can exhaust the allocation and silently stop logging for everyone.
Scope the trace flag narrowly
Trace flags are not limited to users. You can also set them on a specific Apex class or trigger, which is the better choice when you know roughly where the problem lives. A class-scoped flag logs that class at high verbosity while everything else stays quiet, giving you the detail you need without approaching the 20 MB cap or the org-wide allocation.
ForceLens's Smart Capture collapses this whole step: one click creates the trace flag, watches for new logs, and opens them analyzed. See how Smart Capture works.
Step 2: Choose log levels deliberately
| Category | Everyday debugging | SOQL investigation | When log truncates |
|---|---|---|---|
| ApexCode | FINEST | FINE | DEBUG |
| ApexProfiling | INFO | INFO | NONE |
| Database | INFO | FINEST | INFO |
| System | DEBUG | INFO | INFO |
| Workflow | INFO | INFO | ERROR |
| Validation | INFO | INFO | ERROR |
Higher levels log more. FINEST on ApexCode includes every statement and variable assignment; on a big transaction that alone can blow the 20 MB cap.
What each category actually controls
Choosing levels blindly is why logs either truncate or omit the one line you needed. Each category governs a distinct family of events:
| Category | Controls | Raise it when |
|---|---|---|
| ApexCode | Code units, method entry/exit, System.debug, exceptions, heap allocation | You need to see execution flow or variable state |
| ApexProfiling | Cumulative limit usage and per-namespace profiling | Investigating CPU or governor limits |
| Database | SOQL and SOSL text, row counts, DML operations | Chasing query counts or slow queries |
| Workflow | Workflow rules, field updates, and Flow element execution | Debugging Flows or declarative automation |
| Validation | Validation rule evaluation and formula results | A save fails with no Apex error |
| System | Platform-level calls and system method entry | Rarely, usually noise |
| Callout | HTTP request and response detail | Debugging integrations |
The most common mistake is raising everything to FINEST in the hope of catching the problem. That reliably produces a truncated log, and truncation removes lines from the middle, so the evidence you needed is precisely what gets dropped. Raise one category at a time, based on what you are actually investigating.
Note that Workflow is the category that governs Flow logging, which is not obvious from the name. If you are debugging a record-triggered Flow and seeing nothing, that is almost always why: see debugging Salesforce Flows.
The levels, in order
Each level includes everything below it: NONE, ERROR, WARN, INFO, DEBUG, FINE, FINER, FINEST. The jump that matters most is FINE to FINEST on ApexCode: FINEST adds statement-level and variable-assignment logging, which is where log size explodes. FINE gives you code units, method calls and debug output, and is sufficient for most investigations. Reach for FINEST only when you specifically need to see variable values line by line, and scope it to a single class when you do.
Step 3: Understand the anatomy of a log line
14:23:07.0 (5348351)|SOQL_EXECUTE_BEGIN|[12]|Aggregations:0|SELECT Id, Name FROM Account WHERE Id IN :accountIds
14:23:07.0: wall-clock timestamp.(5348351): elapsed time in nanoseconds since transaction start. Subtract two of these to measure a block's duration.SOQL_EXECUTE_BEGIN: the event type.[12]: the Apex line number that emitted it.- The rest is event-specific detail (here, the query text).
Step 4: Follow the key events
| Event | Use it to… |
|---|---|
EXECUTION_STARTED / FINISHED | Bound the transaction. Multiple pairs in one file mean multiple transactions logged together. |
CODE_UNIT_STARTED / FINISHED | Map the call skeleton: each trigger, class entry point, Flow, or workflow evaluation. |
SOQL_EXECUTE_BEGIN / END | See each query and its row count. Repeated identical queries = query in a loop. |
DML_BEGIN / END | See inserts/updates and rows affected: the entry points for trigger recursion. |
USER_DEBUG | Find your own System.debug() output fast (search for the literal string). |
EXCEPTION_THROWN / FATAL_ERROR | Get the exception type, message, and stack trace. FATAL_ERROR is what actually rolled back the transaction. |
LIMIT_USAGE_FOR_NS | Read final governor limit consumption per namespace, and see what the numbers mean. |
Step 5: Read a real log, top to bottom
Events in isolation are less useful than the shape they form. Here is an abbreviated log from a failing Account update, with the reasoning at each stage:
14:23:07.0 (0)|EXECUTION_STARTED
14:23:07.0 (1204)|CODE_UNIT_STARTED|[EXTERNAL]|TRIGGERS
14:23:07.0 (2891)|CODE_UNIT_STARTED|[EXTERNAL]|AccountTrigger on Account trigger event BeforeUpdate
14:23:07.0 (18402)|SOQL_EXECUTE_BEGIN|[15]|Aggregations:0|SELECT Id, Name FROM Contact WHERE AccountId = :accountId
14:23:07.0 (24913)|SOQL_EXECUTE_END|[15]|Rows:3
14:23:07.0 (31002)|SOQL_EXECUTE_BEGIN|[15]|Aggregations:0|SELECT Id, Name FROM Contact WHERE AccountId = :accountId
14:23:07.0 (37441)|SOQL_EXECUTE_END|[15]|Rows:5
Two observations already. The query at line 15 repeats: same line, same text, different results, which means it sits inside a loop. And the transaction is only 37 microseconds in, so this is early; whatever fails later is likely a consequence of this pattern rather than an independent bug.
14:23:09.2 (2104883201)|LIMIT_USAGE|[15]|SOQL|101|100
14:23:09.2 (2104901337)|EXCEPTION_THROWN|[15]|System.LimitException: Too many SOQL queries: 101
14:23:09.2 (2105002914)|FATAL_ERROR|System.LimitException: Too many SOQL queries: 101

Class.AccountService.enrichContacts: line 15, column 1
Class.AccountService.processAccounts: line 42, column 1
Trigger.AccountTrigger: line 8, column 1
The confirmation, and the fix location. Read the stack trace bottom-up: the trigger called processAccounts at line 42, which called enrichContacts, which issued the query at line 15. The loop is at line 42; the query is at line 15. You need to change both by hoisting the query out of the caller's loop.
Finally, the summary block:
14:23:09.2 (2105110002)|LIMIT_USAGE_FOR_NS|(default)|
  Number of SOQL queries: 101 out of 100 ******* CLOSE TO LIMIT
  Number of query rows: 412 out of 50000
  Number of DML statements: 1 out of 150
  Maximum CPU time: 2104 out of 10000
14:23:09.2 (2105180331)|EXECUTION_FINISHED
Note what this rules out. Query rows, DML and CPU are all comfortable, so this is purely a repetition problem, not a volume or performance one. Had CPU also been near its cap, the diagnosis would shift toward the loop itself rather than only the query inside it.
The three questions to ask of any log
Whatever the symptom, the same sequence gets you there fastest:
- What failed? Search
FATAL_ERRORfirst: that is the exception that actually rolled the transaction back.EXCEPTION_THROWNmay appear several times for exceptions that were caught and handled; those are noise. - Where did it fail? Read the stack trace bottom-up to get from the entry point to the failing line.
- Why did it get there? Check
LIMIT_USAGE_FOR_NSto see which resources were near their caps, and scanCODE_UNIT_STARTEDevents for the same trigger appearing more than once, the signature of recursion.
Searches worth memorising
| Search for | Finds |
|---|---|
FATAL_ERROR | The exception that ended the transaction |
LIMIT_USAGE_FOR_NS | Final governor limit consumption |
CODE_UNIT_STARTED | The execution skeleton: every trigger, class and Flow |
USER_DEBUG | Your own System.debug() output |
SOQL_EXECUTE_BEGIN | Every query, with its line number and text |
FLOW_ELEMENT_BEGIN | Flow execution, element by element |
MAXIMUM DEBUG LOG SIZE | Whether the log was truncated (and is lying to you) |
That last one matters more than it looks. A truncated log has missing lines in the middle, so an event you cannot find may have happened and simply not been written. Always check for truncation before concluding something did not run.
Step 6: Common gotchas
- "MAXIMUM DEBUG LOG SIZE REACHED". The log hit 20 MB and lines were skipped. Lower noisy categories or scope tracing to one class.
- The error isn't in this log. Async work (future methods, queueables, batch chunks) runs in separate transactions with separate logs.
- Managed package code is hidden. Other namespaces log at their own levels and much of their internals won't appear.
- Recursion reads as duplication. If a trigger updates its own object, you'll see the same trigger's CODE_UNIT twice. That's re-entry, not a duplicate log.
- Timestamps repeat, elapsed counters don't. The wall-clock portion has limited resolution, so many lines share
14:23:07.0. Always measure with the nanosecond counter in parentheses, never the timestamp. - A caught exception is not the failure.
EXCEPTION_THROWNappears for exceptions your code handled successfully. OnlyFATAL_ERRORended the transaction.
When the log does not contain your error
Three situations produce a log that looks healthy while the user reports a failure:
The work happened asynchronously. Future methods, Queueables, and each Batch Apex chunk run as separate transactions with their own logs, written when the job executes rather than when it was enqueued. The synchronous log ends cleanly because the failure had not happened yet. Look for a later log with the same user and a timestamp after the original.
A platform event or trigger ran as a different user. Automation invoked by platform events or certain system contexts executes as the Automated Process user, which needs its own trace flag.
The transaction never reached your code. A validation rule or required-field error rejects the save before Apex runs. These surface in the UI but produce little or no Apex logging. Check VALIDATION_RULE events, and confirm the log contains a CODE_UNIT_STARTED for your trigger at all.
Tracing "System.NullPointerException: Attempt to de-reference a null object"
The most common Apex runtime failure, and the one a debug log is best at solving. System.NullPointerException: Attempt to de-reference a null object means your code read a field or called a method on a reference that was never assigned, or was assigned from a query that came back empty.
Finding the exact line in the log
The stack trace is in the log, not just in the error email. Search for EXCEPTION_THROWN: the event carries the exception type and the line number that threw it.
16:42:07.412 (412876543)|EXCEPTION_THROWN|[47]|System.NullPointerException: Attempt to de-reference a null object
16:42:07.412 (412901288)|FATAL_ERROR|System.NullPointerException: Attempt to de-reference a null object

Class.AccountTriggerHandler.updateOwner: line 47, column 1
Trigger.AccountTrigger: line 12, column 1
Read the bracketed number first. [47] is the line inside the code unit that threw, and the Class. lines beneath FATAL_ERROR give you the full call chain. Walk it bottom-up: the trigger at line 12 called the handler, which failed at line 47.
Then find what was actually null. Scroll up from the EXCEPTION_THROWN to the nearest SOQL_EXECUTE_END and check its Rows: count. A query that returned zero rows immediately before the throw is the usual cause, because the code assumed a record came back.
16:42:07.409 (409112004)|SOQL_EXECUTE_BEGIN|[44]|Aggregations:0|SELECT Id, OwnerId FROM User WHERE Alias = :alias
16:42:07.411 (411004221)|SOQL_EXECUTE_END|[44]|Rows:0
If the log was captured with Apex Code at FINEST, the VARIABLE_ASSIGNMENT event for that variable shows null as its value, which confirms the cause without guessing.
Then fix it at the source rather than the symptom. Three patterns cover nearly every case:
- Empty query result. Assign to a
Listand testisEmpty()instead of assigning straight to a single sObject, which leaves you a null or throwsSystem.QueryException. - Unqueried relationship.
opp.Account.Nameis null unlessAccount.Namewas in the SELECT. The safe navigation operator,opp.Account?.Name, stops the de-reference. - Map miss.
map.get(id)returns null for an absent key, so checkcontainsKey()or null-check the result before using it.
A related error looks similar but has a different cause: "SObject row was retrieved via SOQL without querying the requested field" means the record exists but the field was never selected. See the SOQL guide for that one.
Making your own debug output findable
Most debugging still comes down to System.debug(), and a few habits make the difference between output you can find instantly and output buried in 40,000 lines.
Use a logging level. System.debug(LoggingLevel.ERROR, ...) keeps your statements visible even when ApexCode is set low, and lets you filter to just your own output:
System.debug(LoggingLevel.ERROR, '>>> ACCT_SYNC | accounts=' + accounts.size()
    + ' | cpu=' + Limits.getCpuTime()
    + ' | queries=' + Limits.getQueries());
Prefix with a searchable marker. A distinctive token such as >>> or a feature name turns finding your output into a single search, rather than scrolling past every managed package's debug lines.
Log limits alongside values. Including Limits.getCpuTime() and Limits.getQueries() in the same statement means one log tells you both what the data was and what it cost, usually removing the need for a second reproduction.
Log collections, not just scalars. Apex serialises collections readably, so System.debug(myMap) prints keys and values. For sObjects, log the specific fields you care about; a full sObject dump is verbose enough to push a log toward truncation on its own.
Doing all of this in one click
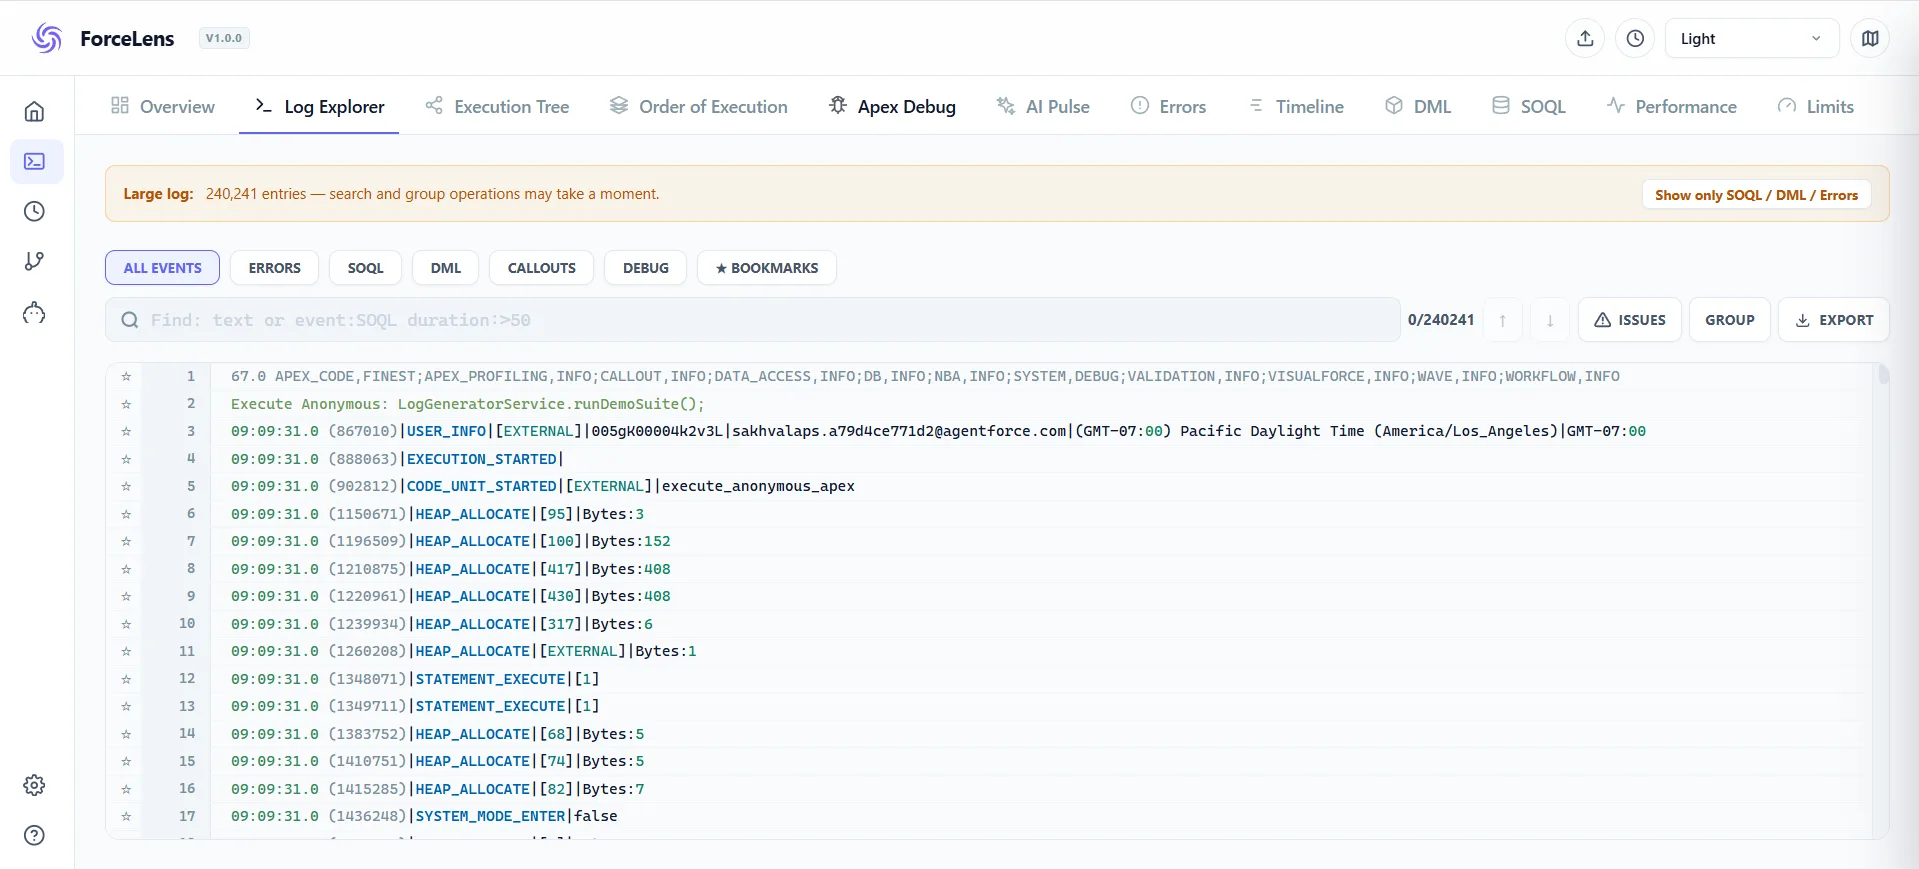
Everything above is what a debug log analyzer automates. ForceLens parses the log in your browser and gives you the execution tree, order of execution, SOQL/DML aggregation, error surfacing and limits report as clickable tabs, free, with nothing uploaded anywhere.
Frequently asked questions
How do I enable debug logs in Salesforce?
In Setup, search for Debug Logs, click New under User Trace Flags, pick the user, a start/expiry time, and a debug level (SFDC_DevConsole is a common default). Logs then generate for every transaction that user runs until the flag expires.
Why is my debug log truncated?
Debug logs are capped at 20 MB per transaction. When a log exceeds the cap, Salesforce skips lines (you'll see "*** Skipped" markers). Reduce log levels for noisy categories like System and Validation, or scope tracing to a specific class.
What log level should I use for Apex debugging?
Start with ApexCode=FINEST, ApexProfiling=INFO, Database=INFO, System=DEBUG. Raise Database to FINEST for SOQL investigations; lower ApexCode if the log truncates.
Where are debug logs stored and for how long?
Setup → Debug Logs. System-generated logs are retained for 24 hours and the org caps total log storage at 1,000 MB. Older logs are deleted as new ones arrive, so save anything important promptly (ForceLens keeps your last 200 analyzed sessions locally).
Why is no debug log being generated at all?
Usually one of five things: the trace flag expired; you traced the wrong user (the log follows whoever triggered execution, which may be an integration or Automated Process user); the org's 1,000 MB log allocation is full, which blocks new trace flags; trace flags were auto-disabled after generating more than 1,000 MB in a 15-minute window; or the log already expired after 24 hours.
What is the difference between EXCEPTION_THROWN and FATAL_ERROR?
EXCEPTION_THROWN records every exception raised, including ones your code caught and handled; these are often normal. FATAL_ERROR is the unhandled exception that actually rolled the transaction back. When debugging a failure, search FATAL_ERROR first.
How do I read the stack trace in a debug log?
Bottom-up. The last line is the entry point (usually the trigger), and the first line is where the exception was thrown. Each line gives class, method and line number, so you can trace the path from entry point to failure. The fix often belongs in a caller rather than at the throwing line.
Why does the error not appear in my debug log?
Most often the work ran asynchronously: future methods, Queueables and each Batch Apex chunk are separate transactions with their own logs, written when the job runs rather than when it was enqueued. Also check whether the log was truncated at 20 MB, or whether a validation rule rejected the save before Apex executed at all.
How do I find what caused a NullPointerException in a debug log?
Search for EXCEPTION_THROWN to get the line that threw, then read the Class. stack lines under FATAL_ERROR bottom-up for the call chain. Scroll up to the nearest SOQL_EXECUTE_END: a Rows:0 result just before the throw is the usual cause. At FINEST, VARIABLE_ASSIGNMENT confirms which variable was null.
Which log events show an Apex exception and its stack trace?
EXCEPTION_THROWN records the type and line each time an exception is raised, including ones your code later catches. FATAL_ERROR appears only for an exception that ended the transaction, and it carries the full stack trace beneath it. If you see EXCEPTION_THROWN with no FATAL_ERROR, something caught it.
Skip the manual steps
ForceLens sets the trace flag, captures the log, and opens it analyzed, all in one click, free, entirely in your browser.