
Fix "Apex CPU Time Limit Exceeded" in Salesforce
"Apex CPU time limit exceeded" means your transaction used more than 10 seconds of CPU (60 seconds for async). Database time doesn't count; the culprit is computation: loops over large collections, nested trigger/Flow recursion, or inefficient code in triggers and managed packages. Find the hotspot in the debug log, then bulkify, cache with maps, or move work async.
The exact error, and what Salesforce is telling you
The error surfaces in one of two forms. In a synchronous transaction (a user saving a record, a Lightning component action, a Visualforce postback), you get:
System.LimitException: Apex CPU time limit exceeded
In asynchronous contexts the wording shifts slightly, and the governor budget is six times larger:
System.LimitException: Apex CPU time limit exceeded
  (Batchable, 60000 ms)
Three properties of this error make it uniquely frustrating, and they are worth internalising before you start debugging:
- It is uncatchable.
System.LimitExceptiondoes not participate intry/catch. You cannot degrade gracefully, log it, or retry within the transaction. When it fires, everything rolls back. - It is cumulative across the whole transaction. The 10 seconds is not per trigger or per class: it is the total for every piece of Apex, Flow, validation rule, workflow and managed-package code that runs from the moment your DML starts until the transaction commits.
- It is non-deterministic. CPU time is measured against real execution on shared infrastructure. A transaction consuming 9,600 ms passes on a quiet org and fails at 10,100 ms under load. This is why the bug "only happens in production" and why it appears intermittently before becoming constant.
That last point matters more than it first appears. If you are seeing this error occasionally, you do not have an occasional problem. You have a transaction permanently sitting near the ceiling, and normal variance is pushing it over. The fix is never to retry; it is to create headroom.
What counts toward CPU time, and what doesn't
| Counts toward CPU | Does NOT count |
|---|---|
| Apex statement execution (loops, string/JSON processing, math) | SOQL query execution time (database) |
| Trigger logic (yours and managed packages') | DML database time |
| Flow element execution, formulas, validation rules, workflow | HTTP callout wait time |
| Declarative automation triggered by your DML | Time spent waiting on locks |
This is why the error is confusing: the visible slow part of a transaction (a big query) is often free, while an innocent-looking loop is what burns the budget.
The usual suspects
- Loops over loops. Nested iteration over related records (O(n²) comparisons) is the single most common cause. 200 trigger records × 1,000 comparisons each is 200,000 iterations before you've done anything useful.
- Trigger recursion. An update trigger that performs updates re-fires automation. Two or three re-entries multiply all trigger CPU.
- Non-bulkified helper methods called once per record instead of once per batch.
- Record-triggered Flows stacking on triggers. Each Flow element costs CPU; a loop inside a Flow over hundreds of records adds up fast.
- Heavy string/JSON processing: serializing large payloads, regex over long text, building huge strings by concatenation.
- Managed package automation you can't see, but which absolutely bills to your transaction's CPU.
1. Nested loops: the O(n²) trap
This is the cause in the clear majority of CPU limit cases, and it is almost always written by someone who knew to avoid SOQL in loops but did not think of iteration itself as expensive. The pattern looks harmless:
// ANTI-PATTERN: 200 opportunities x 5,000 line items = 1,000,000 iterations
for (Opportunity opp : Trigger.new) {
    for (OpportunityLineItem oli : allLineItems) {
        if (oli.OpportunityId == opp.Id) {
            opp.Total_Custom__c += oli.TotalPrice;
        }
    }
}
There is no SOQL and no DML inside the loop, so this passes most code reviews. But the comparison count is the product of the two collection sizes. At 200 × 5,000 you are executing a million string comparisons and a million property reads, which comfortably exceeds 10 seconds on its own.
The fix is to build a Map once, converting the inner scan into a hash lookup:
// CORRECT: group children once, then one pass over parents
Map<Id, List<OpportunityLineItem>> itemsByOpp = new Map<Id, List<OpportunityLineItem>>();
for (OpportunityLineItem oli : allLineItems) {
    if (!itemsByOpp.containsKey(oli.OpportunityId)) {
        itemsByOpp.put(oli.OpportunityId, new List<OpportunityLineItem>());
    }
    itemsByOpp.get(oli.OpportunityId).add(oli);
}

for (Opportunity opp : Trigger.new) {
    for (OpportunityLineItem oli : itemsByOpp.get(opp.Id)) {
        opp.Total_Custom__c += oli.TotalPrice;
    }
}
Total iterations drop from 1,000,000 to roughly 10,200 (5,000 to build the map, then 200 parents plus the 5,000 children distributed among them), a reduction of about 99%. This single refactor resolves more CPU limit errors than every other technique combined. The rule to remember: if you are searching a collection inside a loop, you need a Map.
2. Trigger recursion
A trigger that updates its own object re-enters the entire automation stack: your trigger, every other trigger on that object, all record-triggered Flows, all validation rules and workflow. Two or three re-entries multiply your total CPU by the same factor.
public class TriggerGuard {
    private static Set<Id> processedIds = new Set<Id>();

    public static List<Account> filterUnprocessed(List<Account> records) {
        List<Account> toProcess = new List<Account>();
        for (Account acc : records) {
            if (!processedIds.contains(acc.Id)) {
                processedIds.add(acc.Id);
                toProcess.add(acc);
            }
        }
        return toProcess;
    }
}
A record-level Set<Id> guard is safer than a simple static Boolean hasRun flag. The boolean version silently skips legitimate processing when a transaction updates several batches of the same object, a common source of "the automation didn't run" bugs introduced while fixing CPU problems.
3. Repeated schema and describe calls
Describe calls are far more expensive than they look, and putting one inside a loop is a quiet way to burn seconds:
// ANTI-PATTERN: full describe on every iteration
for (String fieldName : fieldNames) {
    Schema.SObjectType t = Schema.getGlobalDescribe().get('Account');
    // ...
}
Schema.getGlobalDescribe() builds a map of every object in the org on each call. Hoist it above the loop, or cache it in a static variable so it is computed once per transaction and reused.
4. String concatenation in loops
Apex strings are immutable, so result += chunk allocates a brand-new string containing everything accumulated so far on every pass. Building a 10,000-row CSV this way is quadratic in both CPU and heap, and frequently trips the heap size limit at the same time. Collect the pieces in a List<String> and call String.join(parts, '\n') once at the end.
Finding the hotspot in the debug log
Before changing any code, find out where the time is actually going. Optimising the wrong method is the most common way to waste a day on this error. The following procedure needs nothing but the Developer Console.
Step 1: Capture the log at the right level
Set your trace flag so that the timing data you need is present without drowning the log in noise. For CPU work the important setting is PROFILING_INFO, and you want APEX_CODE high enough to see code unit boundaries:
ApexCode:       FINE
ApexProfiling:  FINEST
Database:       INFO
System:         INFO
Workflow:       INFO
Validation:     INFO
Avoid FINEST on ApexCode unless you truly need statement-level detail. It inflates the log, and any log that exceeds the 20 MB cap gets truncated, usually cutting off the summary section you were looking for. See debug log levels explained for the full matrix.
Step 2: Read the limit summary first
Jump to the end of the log and find the LIMIT_USAGE_FOR_NS block. This tells you immediately whether CPU is genuinely your problem, or whether it is a symptom of something else:
LIMIT_USAGE_FOR_NS|(default)|
  Number of SOQL queries: 12 out of 100
  Number of DML statements: 4 out of 150
  Maximum CPU time: 9840 out of 10000 ******* CLOSE TO LIMIT
If CPU is near the cap while SOQL and DML sit comfortably low, the cause is computation: loops, string work, or Flow elements. If SOQL is also high, the real problem is often query volume driving iteration, and fixing the queries resolves the CPU symptom as a side effect.
Note that in an org with managed packages you will see several LIMIT_USAGE_FOR_NS blocks, one per namespace. CPU time is the one governor limit that is shared across all namespaces, so a package's consumption counts against your total even though it appears in a separate block.
Step 3: Rank the code units by elapsed time
Every log line carries a nanosecond elapsed counter, e.g. (5348351). The manual method:
14:23:07.1 (120000000)|CODE_UNIT_STARTED|[EXTERNAL]|OpportunityTrigger on Opportunity trigger event AfterUpdate
14:23:09.8 (2830000000)|CODE_UNIT_FINISHED|OpportunityTrigger on Opportunity trigger event AfterUpdate
2,830,000,000 − 120,000,000 = 2.71 s wall time in that trigger. Do this for every CODE_UNIT pair, rank them, then drill into the worst one. Also check the summary at the end of the log:
LIMIT_USAGE_FOR_NS|(default)|
  Maximum CPU time: 9840 out of 10000 ******* CLOSE TO LIMIT
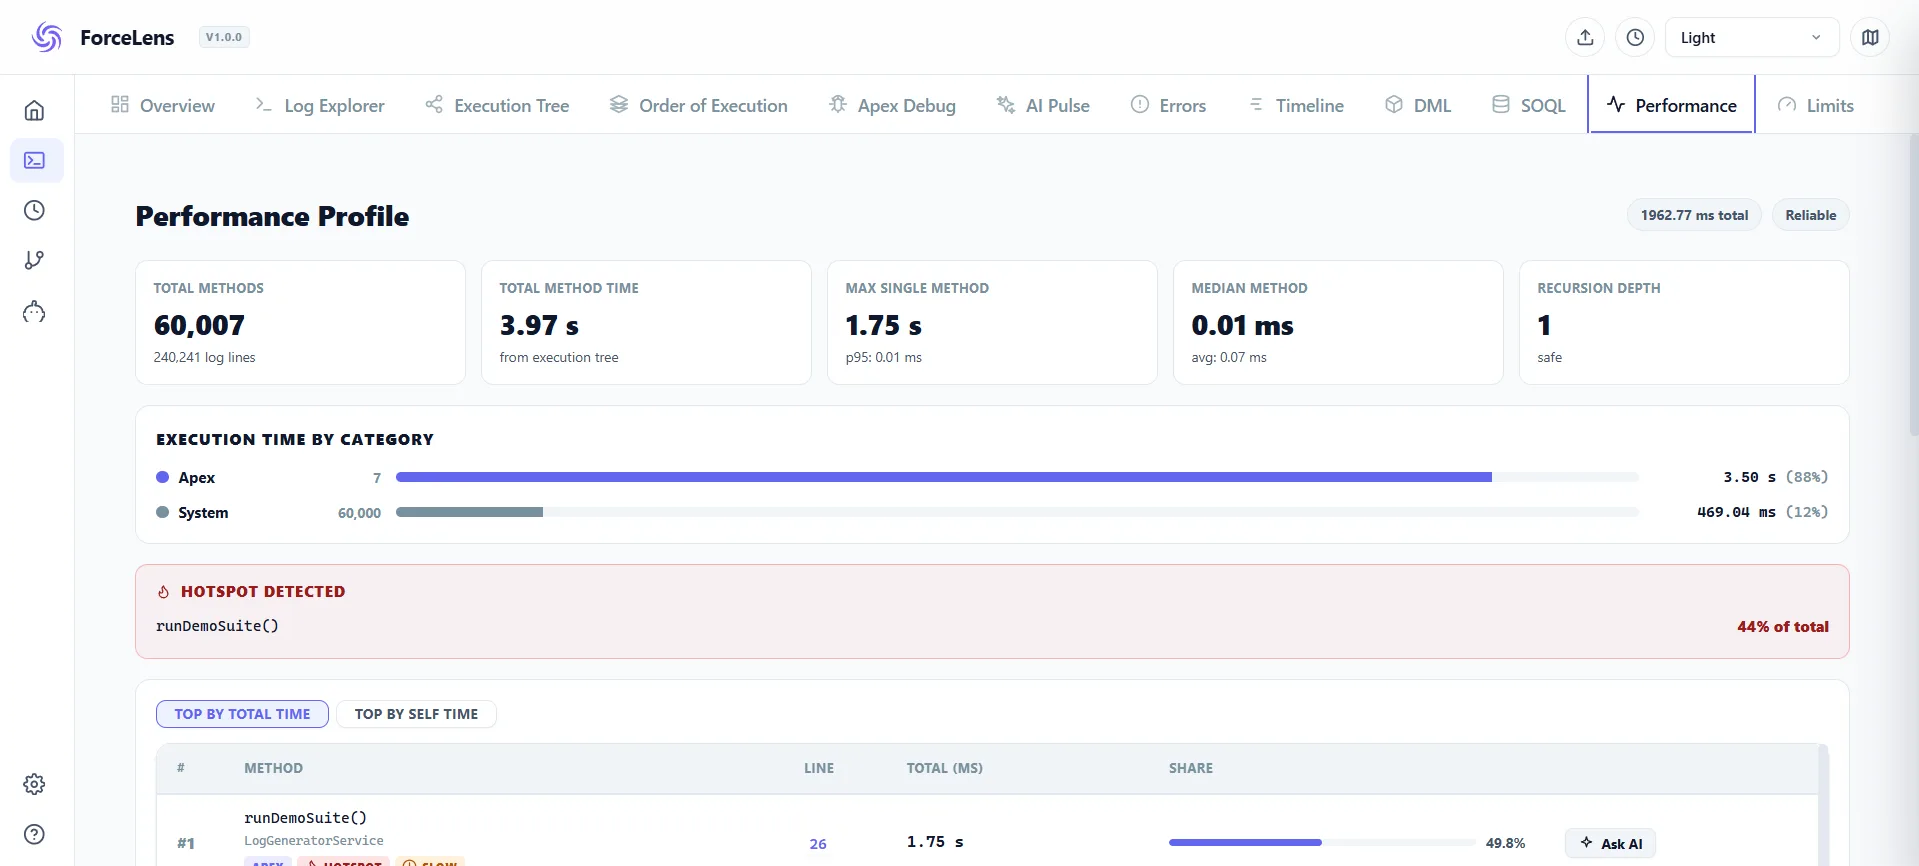
Doing this by hand across a 50,000-line log is exactly the tedium a debug log analyzer removes. ForceLens's Performance tab ranks code units by time consumed, its Timeline shows where the transaction's time physically went, and the Limits tab shows CPU consumption against the 10 s budget, parsed from the same log, in one click.
Fixes that actually work
- Bulkify. Query once before the loop; process collections; never call a per-record helper in a loop. Replace nested loops with
Map<Id, SObject>lookups; this alone turns O(n²) into O(n). - Stop recursion. Use a static guard variable or, better, restructure so triggers don't update their own object unnecessarily.
- Move work async. Queueables, future methods, and batch Apex get a 60 s CPU budget and run outside the user's save. Anything not needed synchronously (roll-ups, integrations, enrichment) belongs there.
- Tune Flows. Consolidate multiple record-triggered Flows per object, avoid loops over large collections inside Flows, and push heavy logic to (bulkified) Apex where appropriate.
- Audit managed packages. If a package's automation dominates the log, check its settings for toggles, or scope which record changes invoke it.
- Cache expensive computation. Static variables survive for the transaction, so compute once and reuse.
Which fix to reach for first
These are not equally valuable. Work down this table in order: the top row resolves most cases and costs the least effort.
| Symptom in the log | Most likely fix | Typical CPU reduction |
|---|---|---|
| One trigger dominates; SOQL count is low | Replace nested loops with Map lookups | 90–99% |
| Same trigger appears 2–3 times in the log | Add a recursion guard | 50–70% |
| Many Flow elements, high element count | Consolidate Flows; move loops to Apex | 40–80% |
| Time spread evenly, nothing dominates | Move non-essential work async | Varies |
| A managed package namespace dominates | Scope package triggers; contact vendor | Varies |
Moving work asynchronous
When the computation is genuinely necessary, relocate it rather than optimise it. Async contexts get 60,000 ms instead of 10,000 ms and run outside the user's save, so the record saves immediately:
public class RollupProcessor implements Queueable {
    private Set<Id> accountIds;

    public RollupProcessor(Set<Id> accountIds) {
        this.accountIds = accountIds;
    }

    public void execute(QueueableContext ctx) {
        // heavy computation now runs with a 60s budget
    }
}

// from the trigger:
if (!System.isBatch() && !System.isFuture()) {
    System.enqueueJob(new RollupProcessor(affectedIds));
}
Two constraints to respect. A synchronous transaction may enqueue up to 50 Queueable jobs, but an asynchronous one may enqueue only one, which is why the guard above checks isBatch() and isFuture() before enqueuing. And enqueue once for the whole collection rather than per record, or a 200-record bulk update will trade your CPU limit error for a queueable limit error.
Good candidates for async: roll-up recalculation, external system integration, notification sending, audit logging, data enrichment. Poor candidates: anything the user must see reflected on the record immediately, and anything a validation rule depends on.
Preventing the error from coming back
Fixing the immediate failure without changing how you build automation guarantees a repeat. Three practices matter:
Test at realistic volume. The default assumption of 200 records in a trigger test is the minimum, not a target. If your org processes 5,000-record data loads, write a test that does so. A transaction that passes at 200 records and fails at 2,000 has an O(n²) pattern in it that volume testing would have exposed in development.
Instrument before you need to. Limits.getCpuTime() is available anywhere in Apex and costs nothing meaningful to call. Logging it at the boundaries of expensive operations gives you the hotspot ranking for free the next time something degrades:
Long startCpu = Limits.getCpuTime();
processLargeDataset(records);
System.debug(LoggingLevel.WARN, 'Rollup CPU: '
    + (Limits.getCpuTime() - startCpu) + 'ms of '
    + Limits.getLimitCpuTime() + 'ms');
Keep one trigger per object. Multiple triggers on the same object execute in an order Salesforce does not guarantee, which makes CPU profiling significantly harder and recursion far more likely. A single trigger delegating to a handler class keeps the execution path readable in the log, which is exactly what you need when you are staring at a 50,000-line log at 2am.
Frequently asked questions
What is the Apex CPU time limit in Salesforce?
10,000 ms (10 seconds) per synchronous transaction; 60,000 ms for asynchronous (batch, future, queueable). Exceeding it throws an uncatchable limit exception and rolls back the transaction. Full list: governor limits explained.
What does NOT count toward CPU time?
Database time: SOQL execution, DML database operations, and callout wait time are excluded. Computation, including Apex statements, trigger and Flow logic, validation, and managed package code, is what counts.
How do I find what's consuming CPU in a debug log?
Diff the elapsed-time counters between CODE_UNIT_STARTED/FINISHED pairs and check LIMIT_USAGE_FOR_NS at the end of the log, or let ForceLens's Performance and Timeline tabs compute the ranking automatically.
Can I catch the CPU limit exception in try/catch?
No. System.LimitException is uncatchable. Prevention (bulkification, recursion control, async offloading) is the only fix.
Why does it only fail in production, not in my sandbox?
Two reasons. Data volume: production triggers process full 200-record batches against millions of related rows, while sandbox tests run against a handful. And CPU time is measured on shared infrastructure, so the same code consumes measurably more under production load. A transaction using 9,600 ms in a sandbox has almost no margin and will fail in production.
Does managed package code count toward my CPU limit?
Yes. CPU time is one of the few governor limits shared across all namespaces. Package automation appears in its own LIMIT_USAGE_FOR_NS block but consumes the same 10-second budget. If a package dominates your log, look for scoping settings, reduce which record changes invoke it, or raise it with the vendor.
Do SOQL queries count toward CPU time?
The database execution time does not. However, iterating the returned rows in Apex does, so a query returning 50,000 rows still causes CPU problems through the loop that processes it. Reduce rows returned rather than only optimising query speed.
How much CPU headroom should I aim for?
Target under 5,000 ms (half the budget) for any transaction on a growing object. Anything above 8,000 ms should be treated as already failing, because normal production variance and future data growth will push it over.
Find your CPU hotspot in seconds
Open the failing transaction's log in ForceLens and the Performance tab ranks every code unit by time consumed, free, local, no setup.