
Find and Fix Slow SOQL Queries in Salesforce Debug Logs
To find SOQL problems in a Salesforce debug log, look at the SOQL_EXECUTE_BEGIN/END event pairs: repeated identical queries mean a query in a loop (the cause of "Too many SOQL queries: 101"), and large row counts on SOQL_EXECUTE_END flag unselective or unbounded queries. Fix them by querying once outside the loop, filtering on indexed fields, and using maps for lookups.
Reading SOQL events in the log
With the Database log category at FINEST, every query produces a pair:
10:41:12.3 (98214532)|SOQL_EXECUTE_BEGIN|[27]|Aggregations:0|SELECT Id, StageName FROM Opportunity WHERE AccountId = :acctId
10:41:12.3 (99871220)|SOQL_EXECUTE_END|[27]|Rows:1
[27]: the Apex line that issued the query, your jump-to-code pointer.Rows:1is rows returned. One row fetched 200 times is a loop query; 48,000 rows once is an unbounded query.- The elapsed-counter difference between BEGIN and END is the query's wall time.
What the row count is really telling you
Before optimising anything, classify the query using the two numbers the log gives you. The combination of repetition count and rows returned points at completely different problems:
| Pattern in the log | Diagnosis | Governor limit at risk |
|---|---|---|
| Same query text, same line, many times | Query inside a loop | 100 SOQL queries |
| One query, tens of thousands of rows | Unbounded or unfiltered query | 50,000 query rows |
| Few queries, each slow (large BEGIN→END gap) | Non-selective filter | Query timeout |
| Same query, different line numbers | Duplicate work across classes | 100 SOQL queries |
| Query text you do not recognise | Managed package or recursion | Both |
Note the difference between the last two rows and everything else. A query repeated from different line numbers is not a loop; it is two classes independently fetching the same data, which is a caching problem rather than a bulkification problem. And a query you do not recognise at all is usually a managed package, which counts against your limits but cannot be edited.
Row counts versus query counts
These are separate governor limits and they fail in different ways. The 100-query limit is about how many times you ask; the 50,000-row limit is about how much you get back. A transaction issuing 4 queries that each return 20,000 rows passes the first limit comfortably and dies on the second.
Worth knowing: rows retrieved by a Database.QueryLocator in Batch Apex do not count toward the 50,000-row limit, which is the entire reason Batch Apex exists. A QueryLocator streams up to 50 million records. This is why "move it to Batch Apex" is the definitive answer for genuine high-volume processing rather than a workaround.
The SOQL patterns that hurt you
1. Queries in loops → "Too many SOQL queries: 101"
The signature in the log is the same query text at the same line number, dozens of times. The fix is always the same shape:
// Bad: one query per record (fires 200 times for a bulk update)
for (Opportunity opp : Trigger.new) {
    Account a = [SELECT OwnerId FROM Account WHERE Id = :opp.AccountId];
}

// Good: one query, then map lookups
Set<Id> acctIds = new Set<Id>();
for (Opportunity opp : Trigger.new) { acctIds.add(opp.AccountId); }
Map<Id, Account> accts = new Map<Id, Account>(
    [SELECT OwnerId FROM Account WHERE Id IN :acctIds]);
for (Opportunity opp : Trigger.new) {
    Account a = accts.get(opp.AccountId);
}
If the repeated query isn't in your code, suspect trigger recursion or a managed package; the log's execution tree shows who issued it.
When the query is not visibly in a loop
The obvious case is easy. These four are the ones that cost people an afternoon:
A query inside a method called from a loop. The loop is in one class, the SOQL is three call levels down in a utility method. Nothing looks wrong at either site. The debug log settles it instantly: the same line number repeating means that line ran many times, regardless of where the loop lives.
// Looks clean at the call site
for (Account a : accounts) {
    processAccount(a);          // no SOQL visible here
}

private void processAccount(Account a) {
    List<Contact> cs = [SELECT Id FROM Contact WHERE AccountId = :a.Id];  // fires per account
}
Trigger recursion. A trigger issuing 30 queries is fine. The same trigger re-entering four times issues 120 and fails. The query count is a symptom; the recursion is the bug. If your log shows the same trigger's CODE_UNIT_STARTED several times, fix that first (see the recursion guard in the CPU time limit guide).
Queries inside a getter. In Visualforce especially, a property getter that queries is re-evaluated every time the page references it. One getter can produce dozens of identical queries with no loop anywhere in your code. Cache the result in a member variable on first access.
private List<Contact> cachedContacts;
public List<Contact> getContacts() {
    if (cachedContacts == null) {
        cachedContacts = [SELECT Id, Name FROM Contact WHERE AccountId = :recordId];
    }
    return cachedContacts;
}
Aggregate queries in loops. COUNT() per record is the same anti-pattern wearing a disguise. Replace the loop with a single GROUP BY:
// One aggregate query replaces N counting queries
for (AggregateResult ar : [SELECT AccountId aid, COUNT(Id) total
                           FROM Contact WHERE AccountId IN :acctIds
                           GROUP BY AccountId]) {
    countsByAccount.put((Id) ar.get('aid'), (Integer) ar.get('total'));
}
Where the limit actually resets
The 100-query limit applies per transaction, not per class, and every trigger, Flow and managed package in that transaction draws from the same budget. It resets only at a genuine transaction boundary: a new asynchronous job (@future, Queueable, each Batch execute()), or the block inside Test.startTest() and Test.stopTest() in a test context. Calling another class does not reset anything.
2. Non-selective queries
A query is selective when its filter can use an index. These defeat indexes:
- Filtering on non-indexed custom fields (standard indexes: Id, Name, OwnerId, CreatedDate, SystemModstamp, lookup/master-detail fields, External IDs and unique fields).
- Leading wildcards:
LIKE '%acme'. - Negative operators:
!=,NOT IN,EXCLUDES. - Comparisons to
nullon non-indexed fields.
On objects with over ~200,000 records, non-selective filters in trigger context can throw "Non-selective query" runtime errors. Fixes: filter on indexed fields, add a custom index via Salesforce Support, or use an External ID field. The Salesforce query optimizer docs cover selectivity thresholds in detail.
The selectivity thresholds
"Selective" is not a judgement call. Salesforce's query optimizer applies specific numbers. A filter qualifies as selective when it passes these thresholds:
| Index type | First million records | Additional records | Effective cap |
|---|---|---|---|
| Standard index | Under 30% | Under 15% | ~1,000,000 records |
| Custom index | Under 10% | Under 5% | ~333,333 records |
Two consequences follow. First, an index on a field with poor cardinality is useless: indexing a checkbox that is true for 60% of records will never be selective, because the filter cannot get under the threshold. Second, selectivity depends on your data, not your schema, so the identical query can be selective in a sandbox and non-selective in production. This is why SOQL_EXECUTE timings from a real production log matter more than any amount of local reasoning.
Using the Query Plan tool
The Developer Console can show you exactly what the optimizer intends to do, before you run anything. Enable it once: Developer Console → Help → Preferences → Enable Query Plan. Then open the Query Editor, enter a query, and click Query Plan.
You get one row per access path the optimizer considered, with these columns:
- Cardinality: estimated rows the query will return.
- Fields: which index, if any, that plan would use.
- Leading Operation Type: the decisive column.
Indexmeans an index will be used.TableScanmeans every record will be examined, and is what you are trying to eliminate.OtherandSharingindicate the optimizer fell back to internal filtering. - Cost: below
1.0means the optimizer considers the plan selective. Above1.0means it does not, and a table scan is likely.
Read it as a simple test: Cost under 1.0 with a Leading Operation Type of Index is a healthy query. Anything showing TableScan on an object with substantial data will be slow now and will fail eventually. Run this against production-like data volumes; a query plan built on 50 sandbox records tells you nothing about behaviour at two million.
Making a query selective again
In rough order of preference:
- Add an indexed field to the filter. Combining a non-selective filter with a selective one lets the optimizer drive from the index and filter the remainder in memory. Adding
CreatedDate = LAST_N_DAYS:30to an unselective query frequently fixes it outright. - Replace negative operators.
Status__c != 'Closed'cannot use an index;Status__c IN ('New','Open','Pending')can. Enumerating the values you want beats excluding the ones you do not. - Remove leading wildcards.
LIKE 'acme%'uses an index.LIKE '%acme'cannot, ever, because the index is ordered from the start of the string. - Avoid null comparisons on non-indexed fields. Standard indexes do not include null rows unless the field is explicitly indexed for nulls. A populated sentinel value is often faster than
= null. - Request a custom index from Salesforce Support for a field you filter on constantly. Free, but only worthwhile where cardinality is genuinely high.
- Use a skinny table for very large objects with expensive recurring reporting queries. Support-provisioned and a significant commitment: a last resort, not a first move.
3. Unbounded row counts: "Too many query rows: 50001"
A single query returning tens of thousands of rows eats the 50,000 query-row governor limit, bloats heap, and slows everything. Add filters, add LIMIT, or process with a SOQL for-loop / Batch Apex, which chunk results instead of materializing them all.
An important subtlety: LIMIT caps the rows you receive but does not necessarily make the query selective. The optimizer may still scan the table to determine which rows satisfy the filter before returning the first 100. LIMIT protects your heap and row count; it does not protect against a table scan. Use it alongside a selective filter, never instead of one.
The three escalating options, cheapest first:
| Approach | Rows toward 50k limit | Peak heap | Use when |
|---|---|---|---|
List<X> y = [SELECT ...] | All of them | All of them | Small, bounded result sets |
| SOQL for-loop | All of them | 200 records at a time | Large results, single transaction |
Batch Apex QueryLocator | Exempt | Fresh per chunk | Genuine high volume |
The middle row is the one people miss. A SOQL for-loop solves the heap problem but every retrieved row still counts toward the 50,000-row limit, so it will not save a query returning 60,000 rows. Only Batch Apex escapes that ceiling.
4. Duplicate queries across a transaction
The pattern the log makes visible and code review does not: two classes each querying the same records in the same transaction. Neither is in a loop, neither is unselective, and neither author did anything obviously wrong; the waste only exists in combination.
The remedy is a transaction-scoped cache. A static map survives for the life of the transaction, so the second caller gets the data without a second query:
public class AccountCache {
    private static Map<Id, Account> cache = new Map<Id, Account>();

    public static Map<Id, Account> get(Set<Id> ids) {
        Set<Id> missing = new Set<Id>();
        for (Id i : ids) {
            if (!cache.containsKey(i)) { missing.add(i); }
        }
        if (!missing.isEmpty()) {
            cache.putAll(new Map<Id, Account>(
                [SELECT Id, Name, OwnerId FROM Account WHERE Id IN :missing]));
        }
        return cache;
    }
}
Only cache data that will not change during the transaction, and be careful combining this with DML on the same records: a stale cache is a worse bug than a redundant query.
5. Selecting too few fields: "SObject row was retrieved via SOQL without querying the requested field"
The one SOQL error caused by asking for less data rather than more. System.SObjectException: SObject row was retrieved via SOQL without querying the requested field means the record was found, but the field you then read was never in the SELECT list. Salesforce deliberately throws rather than returning null, so you cannot mistake "not queried" for "empty".
Spotting it in the log. The exception message names the field, in Object.Field form. Take that field name, then search backwards for the SOQL_EXECUTE_BEGIN whose line number matches the query that produced the record, and read its SELECT clause. The field will not be there.
11:07:44.118 (118221004)|SOQL_EXECUTE_BEGIN|[31]|Aggregations:0|SELECT Id, Name FROM Account WHERE Id IN :ids
11:07:44.121 (121004887)|SOQL_EXECUTE_END|[31]|Rows:200
11:07:44.140 (140662201)|EXCEPTION_THROWN|[38]|System.SObjectException: SObject row was retrieved via SOQL without querying the requested field: Account.Industry
The query at line 31 selected Id and Name; line 38 then read Industry. Note the row count is 200, not 0, which is how you tell this apart from a NullPointerException: the record exists, only the field is absent. For the null case see reading debug logs.
The fix is to add the field to the SELECT, but the useful question is why it was missing. Two causes dominate:
- A relationship field one level out. Querying
Accountdoes not bringAccount.Owner.Email. Traverse it explicitly in the SELECT. - A record passed between methods. The method that queried and the method that reads the field are often far apart. Query the fields the whole call chain needs, not just the ones the immediate caller uses.
Resist fixing this by selecting every field. Wide queries inflate heap and can push a transaction into a heap size error, trading one exception for another.
6. Assuming a query returned rows: System.QueryException
System.QueryException covers two distinct failures that share a name, and telling them apart in the log is quick.
"List has no rows for assignment to SObject"
Thrown when a query that returned nothing is assigned straight to a single sObject. The log shows Rows:0 on the SOQL_EXECUTE_END immediately before the exception.
// Throws when no Account matches
Account a = [SELECT Id FROM Account WHERE Name = :name];

// Safe: check before using
List<Account> found = [SELECT Id FROM Account WHERE Name = :name];
if (!found.isEmpty()) { Account a = found[0]; }
"Non-selective query against large object type"
Thrown, not merely slowed, when a query without a selective filter runs against an object over 200,000 records inside a trigger. The log shows the full query text on SOQL_EXECUTE_BEGIN and no matching SOQL_EXECUTE_END, because it never completed. The fix is the selectivity work in the section above: filter on an indexed field, or move the work to Batch Apex where the restriction does not apply.
A triage order that saves time
When a transaction is failing on SOQL, work in this order. Each step is cheaper than the one after it, and roughly half of all cases are resolved by the first two:
- Count the queries in the log. If the count is near 100, you have a repetition problem. Find the repeated line number and hoist it out of its loop. Do not optimise individual queries yet.
- Check for repeated
CODE_UNIT_STARTEDon the same trigger. If a trigger appears more than once, recursion is multiplying every query beneath it. Fixing that one bug can drop the count by half. - Sort by rows returned. Any single query returning more than a few thousand rows needs a tighter filter, a SOQL for-loop, or Batch Apex, in that order of preference.
- Sort by elapsed time. Only now look at individual query speed. Take the slowest one to the Query Plan tool and check for
TableScan. - Look for identical query text at different line numbers. That is duplicated work across classes, and a transaction-scoped cache removes it.
The ordering matters because these problems mask each other. Optimising a query's selectivity is wasted effort if the real issue is that it runs 200 times, and adding a cache achieves nothing if recursion is re-executing the whole stack.
Aggregate view: the fast way
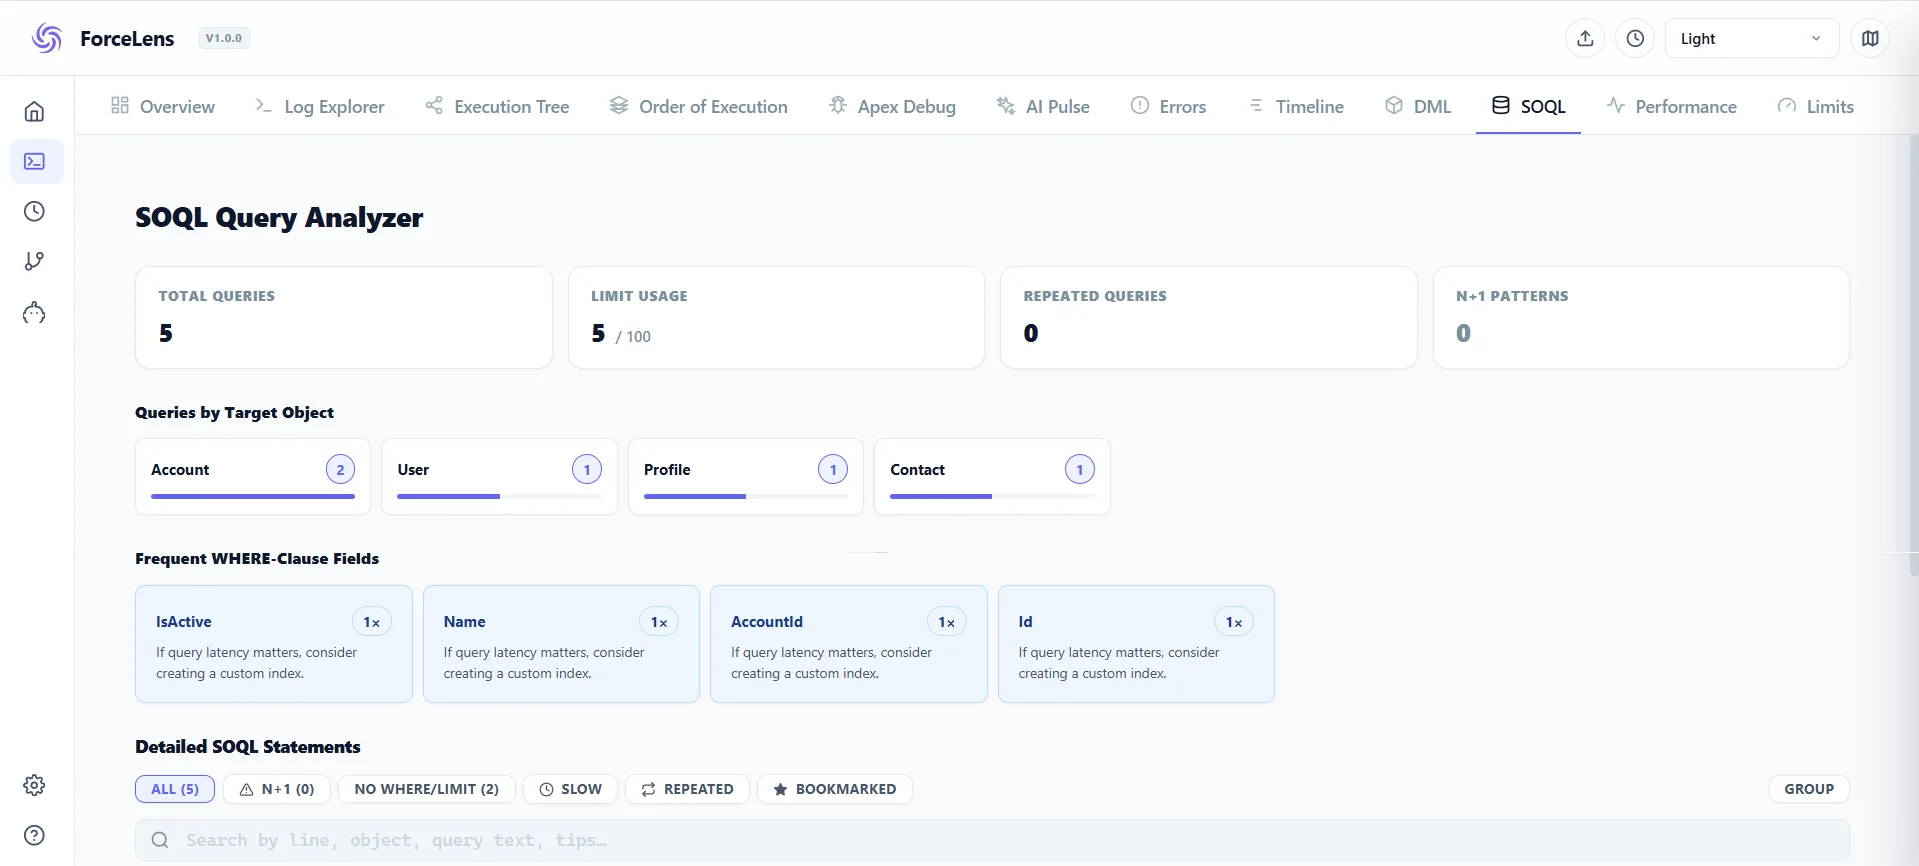
Scrolling a 40,000-line log to hand-count query repetitions is the archaeology ForceLens exists to end. Its SOQL tab aggregates every query in the transaction (count, total rows, originating code unit), so a query-in-a-loop shows up as "×200" on one row, and the unbounded query tops the rows column. The Limits tab shows the same transaction's query count against the 100 cap (governor limits explained).
Frequently asked questions
How do I fix "Too many SOQL queries: 101"?
Find the query firing in a loop (same query text and line number repeated in the log), move it outside the loop with an IN :ids filter, and use a Map for per-record lookup. Also rule out trigger recursion re-firing automation.
What makes a SOQL query non-selective?
Filters that can't use an index: non-indexed fields, leading-wildcard LIKE, negative operators, and null comparisons. On large objects this causes errors in trigger context and slowness everywhere.
How do I see SOQL queries in a debug log?
Set the Database category to FINEST; each query then logs SOQL_EXECUTE_BEGIN (query text, line number) and SOQL_EXECUTE_END (row count). ForceLens aggregates them automatically in its SOQL tab.
Does SOQL time count toward the CPU limit?
No, database time is excluded from the Apex CPU limit. But retrieved rows count toward the 50,000 query-row limit, and slow queries still slow the transaction.
How do I use the Query Plan tool?
Enable it in Developer Console → Help → Preferences → Enable Query Plan, then click Query Plan in the Query Editor. Look at two columns: Leading Operation Type should read Index rather than TableScan, and Cost should be below 1.0. Run it against production-scale data: a plan built on a few sandbox records tells you nothing about behaviour at two million.
Does adding LIMIT make a query selective?
No. LIMIT caps the rows returned to you, but the optimizer may still scan the table to work out which rows qualify. It protects heap and row count, not query speed. Pair it with an indexed filter rather than relying on it alone.
Do Batch Apex queries count toward the 50,000 row limit?
Rows retrieved by a Database.QueryLocator in the start() method are exempt and can stream up to 50 million records. Queries you issue inside execute() count normally, but against a fresh limit for each chunk.
Why is my query selective in sandbox but not in production?
Selectivity thresholds are proportional to actual data volume, so the same filter can fall under 10% of a small sandbox dataset and well over it in production. Always validate against production-like volumes, and prefer timings from a real production debug log over reasoning about the query in isolation.
What does "SObject row was retrieved via SOQL without querying the requested field" mean?
The record was found, but the field you read was never in the SELECT list. Salesforce throws instead of returning null so you cannot confuse "not queried" with "empty". In the log, find the SOQL_EXECUTE_BEGIN for that query and read its SELECT clause: the field named in the exception will be missing. The row count will be non-zero, which distinguishes it from a NullPointerException.
How do I stop "List has no rows for assignment to SObject"?
That is System.QueryException, thrown when a query returning nothing is assigned straight to a single sObject. Assign to a List and check isEmpty() first. In the log the confirmation is a Rows:0 on the SOQL_EXECUTE_END immediately before the exception.
See every query at a glance
Open a log in ForceLens and the SOQL tab shows each query's count, rows and origin, so loop queries are unmissable. Free and local.