
Salesforce Governor Limits Explained (with a Cheat Sheet)
Governor limits are per-transaction resource caps Salesforce enforces to protect its shared, multitenant infrastructure. The ones you'll hit most: 100 SOQL queries, 150 DML statements, 10 seconds of CPU time, and 6 MB of heap per synchronous transaction. Exceeding any of them throws an uncatchable exception and rolls the transaction back.
The cheat sheet (per transaction)
| Limit | Synchronous | Asynchronous |
|---|---|---|
| SOQL queries issued | 100 | 200 |
| Records retrieved by SOQL | 50,000 | 50,000 |
| Records retrieved by Database.getQueryLocator (non-batch) | 10,000 | 10,000 |
Records retrieved by a Batch Apex start() QueryLocator | 50,000,000 | |
| SOSL queries issued | 20 | 20 |
| DML statements issued | 150 | 150 |
| Records processed by DML | 10,000 | 10,000 |
| CPU time | 10,000 ms | 60,000 ms |
| Heap size | 6 MB | 12 MB |
| HTTP callouts | 100 | 100 |
| Cumulative callout timeout | 120 s | 120 s |
| Future method invocations | 50 | 0 in batch/future context; 50 in Queueable |
| Queueable jobs enqueued | 50 | 1 (from any async context) |
| Maximum transaction execution time | 10 minutes | |
Values are the standard published limits, so always confirm edge cases against the official Salesforce governor limits reference, since Salesforce occasionally revises them.
Find your error message
If you arrived here from a specific failure, start with the exact text Salesforce gave you. Each row names the real cause and where the detailed fix lives:
| Error message | Usual cause | Detailed guide |
|---|---|---|
| Too many SOQL queries: 101 | Query inside a loop, or trigger recursion | SOQL optimization |
| Too many DML statements: 151 | DML inside a loop | See the DML section below |
| Apex CPU time limit exceeded | Nested loops, recursion, heavy Flows | CPU time limit |
| Apex heap size too large | Large query results held in memory | Heap size limit |
| Too many query rows: 50001 | One unbounded query on a large object | SOQL optimization |
| Too many DML rows: 10001 | Bulk operation exceeding the row cap | Move to Batch Apex |
| System.LimitException: Too many callouts: 101 | Callout inside a loop | Batch the requests |
| Maximum trigger depth exceeded | Runaway recursion (16 levels) | Order of execution |
| System.NullPointerException: Attempt to de-reference a null object | Empty query result or unqueried relationship field | Reading debug logs |
| SObject row was retrieved via SOQL without querying the requested field | Field read but never listed in the SELECT | SOQL optimization |
| MIXED_DML_OPERATION | Setup and non-setup DML in one transaction | Order of execution |
| CANNOT_INSERT_UPDATE_ACTIVATE_ENTITY | A trigger or validation rule blocked the save | Flow error emails |
| UNABLE_TO_LOCK_ROW | Concurrent updates competing for the same parent record | See the DML section below |
One pattern connects most of these: the limit you hit is rarely the bug. Trigger recursion presents as too many SOQL queries. An unbounded query presents as a heap error. Before optimising the thing that failed, confirm it is the cause rather than the symptom.
Why these limits exist
Governor limits feel arbitrary until you understand the architecture. Salesforce is multitenant: your org shares application servers and database infrastructure with thousands of others. Without hard per-transaction caps, one org's runaway loop would degrade performance for everyone on that instance.
This explains two things developers find frustrating. First, limits are not negotiable: you cannot buy your way past the CPU limit, because it exists to protect other tenants, not to sell you an upgrade. Second, limit exceptions cannot be caught. If try/catch could swallow a limit exception, code could continue consuming resources after exceeding its allocation, which would defeat the purpose entirely.
The practical takeaway: treat limits as design constraints from the start rather than problems to solve later. Code written to be bulk-safe never encounters most of this page.
Sync vs async: which budget are you on?
A transaction is synchronous when it runs in response to a user action or API call (record save, Lightning component call, REST request). It's asynchronous (with the bigger CPU/heap budget) when it runs as batch Apex, a future method, a queueable, or scheduled Apex. This is why "move it async" is a standard fix for CPU time limit errors: the same code gets six times the CPU budget and runs outside the user's save.
What counts as one transaction
Limits reset at a transaction boundary, and knowing exactly where those fall is what makes async offloading work. A new transaction begins at each of these:
- A user action or API call (a record save, Lightning action, REST request, or Visualforce postback).
- Each
@futuremethod invocation. - Each Queueable job's
execute(). - Each Batch Apex
execute()call: every chunk gets a completely fresh set of limits. - Each scheduled Apex run.
- The code between
Test.startTest()andTest.stopTest()in a test method.
Calling another class, entering a different trigger, or invoking a Flow does not start a new transaction. Everything triggered by one save (your triggers, other developers' triggers, record-triggered Flows, validation rules, workflow, roll-up recalculation, and managed package automation) draws from a single shared budget. This is why an org that worked fine for years starts failing after one package install.
The DML limits in practice
DML has two separate caps and they fail differently. 150 statements is about how many times you call insert, update, delete or upsert. 10,000 rows is about how many records those calls touch in total.
"Too many DML statements: 151"
The statement limit is almost always a loop:
// ANTI-PATTERN: one update per record, fails at 151 records
for (Account a : accounts) {
    a.Status__c = 'Reviewed';
    update a;
}
// CORRECT: one statement for the whole collection
List<Account> toUpdate = new List<Account>();
for (Account a : accounts) {
    a.Status__c = 'Reviewed';
    toUpdate.add(a);
}
update toUpdate;
A single collection DML counts as one statement no matter how many records it contains. That is why the corrected version can update 10,000 records while the loop version dies at 151.
When part of a batch may legitimately fail, use the Database methods with allOrNone set to false so valid records still commit:
Database.SaveResult[] results = Database.update(toUpdate, false);
for (Integer i = 0; i < results.size(); i++) {
    if (!results[i].isSuccess()) {
        System.debug(LoggingLevel.ERROR, 'Row ' + i + ' failed: '
            + results[i].getErrors()[0].getMessage());
    }
}
Note that DML on records that fire their own triggers consumes limits from the same transaction budget. Updating 200 Accounts whose trigger updates related Contacts spends your DML allowance twice: the visible statement and the cascade beneath it.
UNABLE_TO_LOCK_ROW
UNABLE_TO_LOCK_ROW, unable to obtain exclusive access to this record is not a governor limit at all, which is why tuning your code rarely fixes it. It is a row-lock conflict: two transactions tried to update the same record, or two child records sharing one parent, at the same moment. Salesforce locks the parent when you write a child, so a bulk load of Contacts serialises on their shared Account.
Spotting it in the log. The DML_BEGIN that failed will be followed by an exception naming the locked record id. The tell is the timing: compare the timestamps on DML_BEGIN and the error, and a lock conflict usually shows a long pause, often close to ten seconds, because Salesforce waits for the lock before giving up.
14:22:03.118 (118004221)|DML_BEGIN|[62]|Op:Update|Type:Contact|Rows:200
14:22:13.240 (13240118776)|EXCEPTION_THROWN|[62]|System.DmlException: Update failed. First exception on row 0 with id 0031x00000AbCdEAAV; first error: UNABLE_TO_LOCK_ROW, unable to obtain exclusive access to this record
That ten-second gap between the two timestamps is the lock wait. A code problem would fail immediately.
The fixes are about ordering and concurrency, not efficiency:
- Sort records before DML. Processing child records grouped by parent id means each parent is locked once rather than repeatedly.
- Reduce batch size. In Batch Apex, a smaller scope shortens how long each lock is held.
- Serialise the writers. If an integration and a trigger both update the same records, stagger them rather than letting them collide.
- Use
FOR UPDATEdeliberately when you genuinely need to lock rows you are about to modify, so the lock is taken in a predictable order.
Because this error depends on what else was running at the time, reproducing it needs a log from the failing moment rather than a clean retry. See reading debug logs for capturing a trace on the user hitting the conflict.
How limits appear in a debug log
Near the end of every log, the LIMIT_USAGE_FOR_NS event reports consumption per namespace:
LIMIT_USAGE_FOR_NS|(default)|
  Number of SOQL queries: 96 out of 100 ******* CLOSE TO LIMIT
  Number of query rows: 12043 out of 50000
  Number of DML statements: 12 out of 150
  Maximum CPU time: 4210 out of 10000
  Maximum heap size: 1873921 out of 6000000
Key detail: certified managed packages get their own bucket for most counted limits (their own 100 queries, etc.), which is why the report is namespaced, but CPU time and heap are shared across every namespace in the transaction. A greedy package spends your CPU.
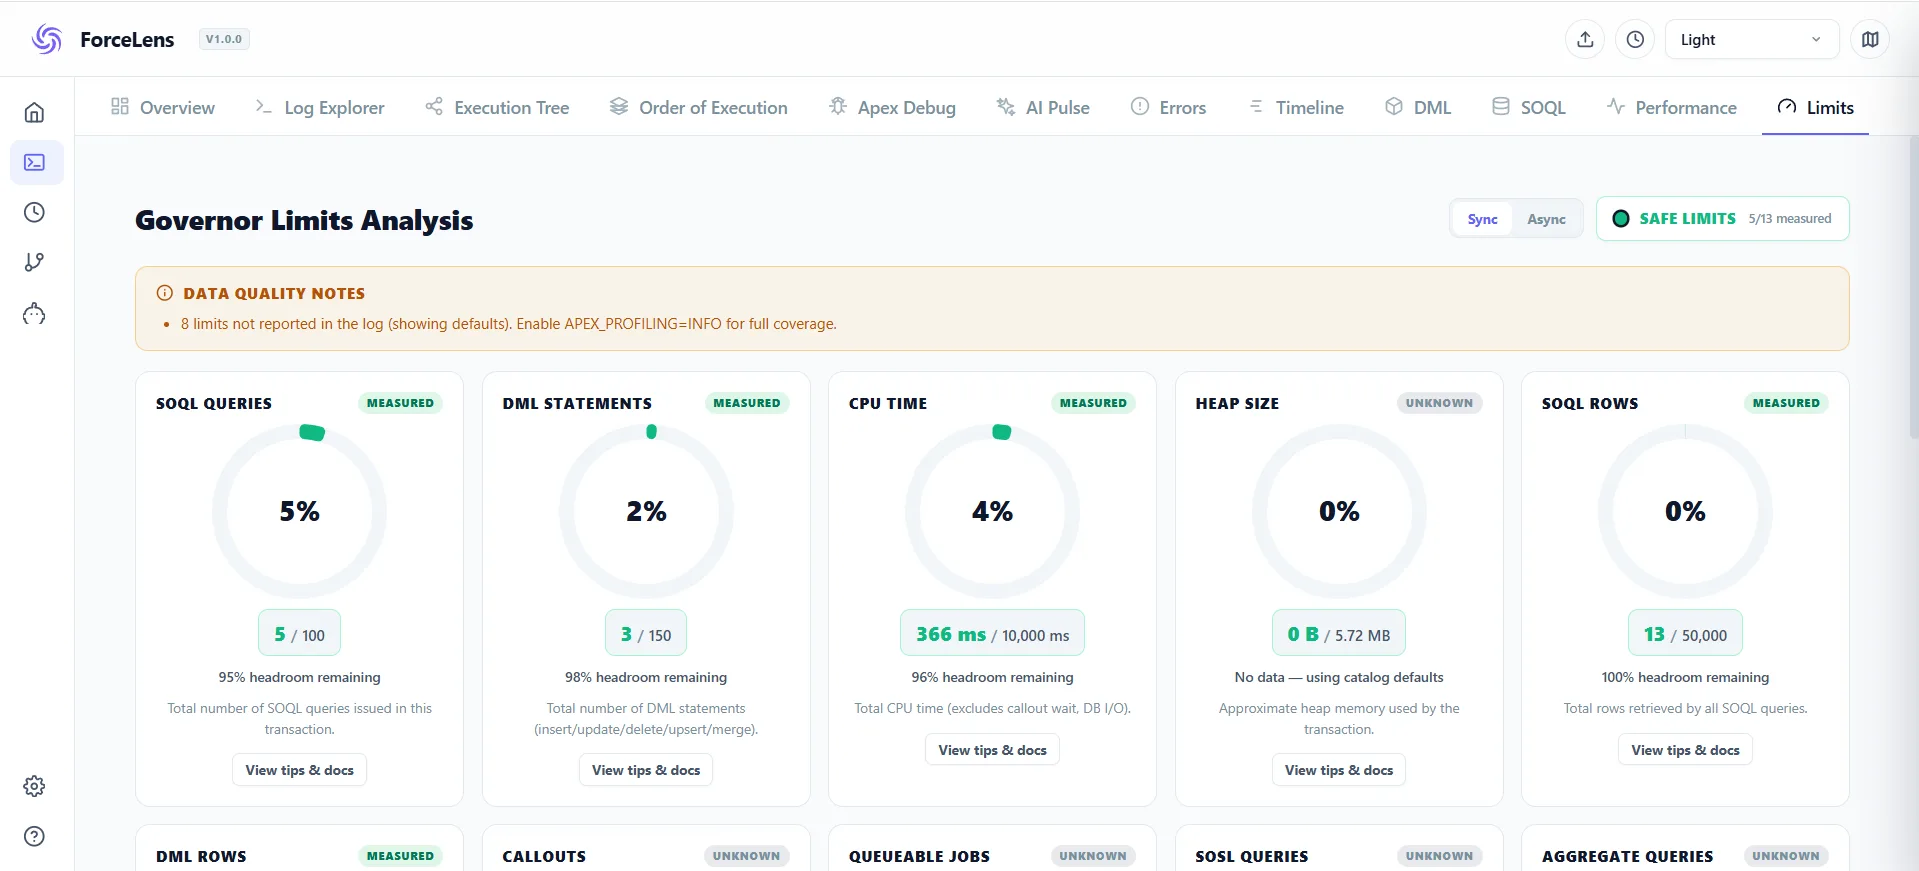
ForceLens's Limits tab renders this section as a visual dashboard with per-limit progress bars, so a 96/100 SOQL situation is impossible to miss. Combined with the SOQL tab, you can jump from "too many queries" straight to which query fired 96 times.
Monitoring limits from code
System.debug('SOQL: ' + Limits.getQueries() + ' / ' + Limits.getLimitQueries());
System.debug('CPU:  ' + Limits.getCpuTime() + ' / ' + Limits.getLimitCpuTime());
System.debug('Heap: ' + Limits.getHeapSize() + ' / ' + Limits.getLimitHeapSize());
The System.Limits class reads live consumption mid-transaction. It's useful for defensive branching in loops that might approach a cap, and for instrumenting suspect code paths with USER_DEBUG checkpoints you can then trace in the log.
Defensive branching before a cap
Because limit exceptions cannot be caught, the only way to handle an approaching cap is to check before crossing it and change course. This pattern hands the remaining work to an async job rather than failing:
for (Account a : accountsToProcess) {
    // leave margin: the check itself and the enqueue both cost something
    if (Limits.getCpuTime() > Limits.getLimitCpuTime() * 0.8) {
        System.enqueueJob(new ContinueProcessing(remainingIds));
        break;
    }
    process(a);
}
Treat this as a safety net, not a design. If a transaction regularly approaches 80% of any limit, the correct fix is to restructure it. A defensive check only converts a hard failure into partial processing, which can be harder to diagnose than the original error.
Asserting on limits in tests
Limit regressions are cheap to catch in CI and expensive to find in production. One assertion prevents the regression permanently:
@isTest
static void bulkUpdateStaysWithinLimits() {
    List<Account> accounts = TestDataFactory.createAccounts(200);

    Test.startTest();
    update accounts;
    Integer queries = Limits.getQueries();
    Integer cpu = Limits.getCpuTime();
    Test.stopTest();

    System.assert(queries < 50, 'SOQL exceeded half the budget: ' + queries);
    System.assert(cpu < 5000, 'CPU exceeded half the budget: ' + cpu);
}
Assert against half the budget rather than the actual cap. A test asserting < 100 queries passes at 99 and gives you no warning at all; the point is to fail while there is still headroom to lose.
Callout and async limits
These trip people less often but are harder to diagnose when they do, because the failure usually appears somewhere other than the code that caused it.
The 120-second cumulative callout timeout
The 100-callout cap gets the attention, but the cumulative timeout is what actually breaks integrations. All callouts in a transaction share a 120-second budget. Ten callouts to an endpoint that takes 15 seconds each will exhaust it at the eighth, and the error names the eighth callout even though the design was the problem.
Always set an explicit timeout rather than accepting the default, so one unresponsive endpoint cannot consume the entire allowance:
HttpRequest req = new HttpRequest();
req.setEndpoint('callout:My_Named_Credential/api/v1/records');
req.setMethod('GET');
req.setTimeout(10000);   // 10s ceiling for this call
HttpResponse res = new Http().send(req);
Where an API supports batch endpoints, one request for 200 records beats 200 requests. Where it does not, move the work to Queueable jobs so each gets its own 120-second budget.
You cannot call out after DML
A rule that surprises people regularly: once a transaction has performed uncommitted DML, callouts are blocked. The error reads You have uncommitted work pending. Please commit or rollback before calling out.
Salesforce enforces this because an open database transaction cannot be held while waiting on an external system. The remedy is to move the callout into an async context, which runs after the DML commits:
public class NotifyExternalSystem implements Queueable, Database.AllowsCallouts {
    private Set<Id> recordIds;
    public NotifyExternalSystem(Set<Id> recordIds) { this.recordIds = recordIds; }

    public void execute(QueueableContext ctx) {
        // DML has committed; callouts are permitted here
    }
}
The Database.AllowsCallouts marker interface is required. Without it the same error appears inside the Queueable, which is a confusing place to meet it.
Async job limits
| Constraint | Value | Catches people out because |
|---|---|---|
| Queueables enqueued from a synchronous transaction | 50 | Generous, but a trigger enqueuing per record still burns it |
| Queueables enqueued from an async context | 1 | Chaining allows exactly one child job per parent |
@future calls per transaction | 50 | A future called per record in a loop exhausts it |
@future from batch or future context | 0 | You cannot chain @future from @future |
| Batch jobs queued or active | 5 | Org-wide, not per user; shared with everyone |
| Async executions per 24 hours | 250,000 or 200 × licences | Org-wide daily ceiling |
The second row is where chaining designs come unstuck: a running Queueable may enqueue exactly one child job, so a job that tries to fan out into several parallel jobs fails on the second call. Chain sequentially instead, and build in a stop condition; runaway chains consume the org's daily async allocation quickly.
In synchronous code the 50-job allowance is comfortable, but a trigger that enqueues per record still exhausts it during a bulk load: 200 records means 200 jobs. Collect the IDs and enqueue once for the whole batch.
Staying out of trouble
- Never put SOQL or DML in a loop. Collect IDs, query once with
IN :ids, write once with a collection DML. This single habit prevents most SOQL 101 and DML 151 errors. - Watch query rows, not just query count. 50,000 retrieved rows is reachable by one unbounded query on a big object.
- Control trigger recursion. Every re-entry re-spends every limit.
- Mind heap with large payloads. Building giant strings or deserializing big JSON eats the 6 MB fast; process in chunks or async.
- Check the log after big transactions, not just failing ones. "96 out of 100" today is an error next month when data grows.
Two habits matter more than the rest. Design for 200 records, always. Salesforce hands triggers up to 200 records per batch, and code written for a single record is the root cause of nearly every limit error on this page. If a method takes one record where it could take a list, that is where your next incident will come from.
Treat 50% consumption as your ceiling. Limits are consumed by everything in the transaction, including automation you did not write and packages installed after you shipped. Code sitting at 90% of a limit is not passing; it is failing later, on someone else's schedule.
Frequently asked questions
What are governor limits in Salesforce?
Per-transaction resource caps enforced because orgs share multitenant infrastructure: 100 SOQL queries, 150 DML statements, 10 s CPU, 6 MB heap (sync values), and more. Exceeding one throws an uncatchable limit exception and rolls back the transaction.
How do I see governor limit usage in a debug log?
Find LIMIT_USAGE_FOR_NS near the end of the log: it lists consumption against each maximum, per namespace. ForceLens renders the same data as a visual limits dashboard.
Do managed packages get their own limits?
Certified managed packages get separate buckets for most counted limits (SOQL, DML), but CPU time and heap are shared across all namespaces in the transaction.
How can I check limits from Apex code?
Use System.Limits methods, such as Limits.getQueries(), Limits.getCpuTime(), Limits.getHeapSize() and their getLimit* counterparts, to read live consumption at runtime.
Can I increase or buy my way past governor limits?
No. Limits exist to protect the shared multitenant infrastructure other orgs run on, so they are not a paid tier. The answer is always architectural: bulkify, move work asynchronous where each job gets a fresh budget, or use Batch Apex for genuine high volume.
When do governor limits reset?
At each transaction boundary: a user action or API call, each @future invocation, each Queueable execute(), each Batch Apex execute() chunk, each scheduled run, and the block inside Test.startTest()/Test.stopTest(). Calling another class, entering another trigger, or invoking a Flow does not reset anything.
Why did my org start hitting limits after installing a package?
Everything triggered by one save shares a single budget. A managed package adding triggers or Flows to an object you already automate consumes CPU and heap from the same allocation; those two are shared across all namespaces even though the log reports them separately. Transactions that previously sat at 70% can cross the cap with no change to your own code.
Does one DML statement on 200 records count as 1 or 200?
One statement, and 200 rows. The two limits are separate: 150 statements and 10,000 rows per transaction. This is why a collection DML outside the loop can update thousands of records while the same work done record-by-record fails at 151.
What is the difference between the 50,000 row limit and the QueryLocator limit?
Regular SOQL can retrieve 50,000 rows per transaction. Database.getQueryLocator in a non-batch context returns up to 10,000. A QueryLocator returned from a Batch Apex start() method is the exception: it streams up to 50 million records, because each execute() chunk is processed as its own transaction.
Is UNABLE_TO_LOCK_ROW a governor limit?
No. It is a row-lock conflict, which is why optimising your code rarely fixes it. Two transactions tried to write the same record, or two children sharing one parent, at once. In the log the giveaway is a long pause between DML_BEGIN and the exception, because Salesforce waits for the lock before failing.
See your limits, don't count them
Open any debug log in ForceLens and the Limits tab shows every governor limit as a progress bar: free, local, one click.