
Salesforce Debug Log Analyzer: Read Apex & Flow Logs Visually
A Salesforce debug log analyzer parses raw Apex debug logs and turns them into visual, navigable views: execution trees, timelines, SOQL and DML breakdowns, and governor limit reports. The result is that you can find the root cause of an error or slowdown in seconds instead of scrolling through thousands of log lines.
This guide explains what's actually inside a Salesforce debug log, how to read one by hand, why raw logs are so painful at scale, and what a modern analyzer like ForceLens does differently. It's written for Salesforce developers, admins, and architects who debug Apex, Flows, and performance issues.
What a Salesforce debug log actually contains
Every debug log is a chronological event stream of a single transaction. Each line has a timestamp, an event type, and event-specific details. The events you'll rely on most:
| Event | What it tells you |
|---|---|
EXECUTION_STARTED / FINISHED | The boundaries of the transaction. |
CODE_UNIT_STARTED / FINISHED | Entry into a trigger, class method, Flow, or workflow: the skeleton of the execution tree. |
SOQL_EXECUTE_BEGIN / END | Each query, its SOQL text, and rows returned. |
DML_BEGIN / END | Each insert/update/delete and how many rows it touched. |
FLOW_START_INTERVIEW / FLOW_ELEMENT_* | Which Flow ran and which elements executed. |
USER_DEBUG | Your own System.debug() output. |
EXCEPTION_THROWN / FATAL_ERROR | Where things blew up, with the stack trace. |
LIMIT_USAGE_FOR_NS | Governor limit consumption: SOQL queries, DML, CPU time, heap. |
For the full event catalog, see Salesforce's own debug log documentation. For a hands-on walkthrough of enabling and reading logs, see our tutorial: how to read Apex debug logs step by step.
Start here: what are you actually debugging?
Log analysis is faster when you know which question you are asking. Find your symptom below and go straight to the guide that covers it; each one includes the manual method as well as the tooling.
| Symptom | What to look at first | Guide |
|---|---|---|
| "Too many SOQL queries: 101" | Repeated query text at the same line number | SOQL optimization |
| "Apex CPU time limit exceeded" | Elapsed time between code unit pairs | CPU time limit |
| "Apex heap size too large" | Heap checkpoints around large queries | Heap size limit |
| A field was overwritten unexpectedly | Every automation that touched the record, in order | Order of execution |
| A Flow failed and the email is unclear | FLOW_ELEMENT_ERROR and preceding elements | Flow error emails |
| A Flow behaves differently in production | Flow events interleaved with triggers | Flow debugging |
| No log is being generated at all | Trace flag target and expiry | Debug log levels |
| The log is truncated | Which categories are set too high | Debug log levels |
| I do not know where to start | The three questions below | How to read debug logs |
If you are unsure which applies, three searches answer most questions in under a minute: FATAL_ERROR tells you what ended the transaction, the stack trace beneath it tells you where, and LIMIT_USAGE_FOR_NS tells you what the transaction cost. Everything else is detail.
Why raw logs are hard to read
- Volume. A single record save in a mature org can produce tens of thousands of lines: triggers, record-triggered flows, validation, roll-ups, and recursive re-entry all interleave.
- Truncation. Logs are capped at 20 MB; above that Salesforce silently drops lines, so the one line you need may be missing unless log levels are tuned.
- No structure. The log is flat text. Nesting (which trigger called which class which ran which query) exists only implicitly, in matching
*_STARTED/*_FINISHEDpairs you have to track mentally. - No aggregation. "How many queries did this transaction run, and which one returned 50,000 rows?" requires you to count by hand.
The structural problem is worth seeing concretely. Nesting exists only as matched pairs, so working out what called what means tracking depth manually across thousands of lines:
CODE_UNIT_STARTED|AccountTrigger on Account trigger event BeforeUpdate
  CODE_UNIT_STARTED|AccountService.validateAll
    SOQL_EXECUTE_BEGIN|[42]|SELECT Id FROM Contact WHERE AccountId = :id
    SOQL_EXECUTE_END|[42]|Rows:3
  CODE_UNIT_FINISHED|AccountService.validateAll
CODE_UNIT_FINISHED|AccountTrigger on Account trigger event BeforeUpdate
Real logs do not indent. Every line begins at column zero, the pairs are separated by hundreds of unrelated lines, and a trigger that re-enters produces a second identical block elsewhere in the file. Reconstructing the hierarchy is mechanical work that a parser does perfectly and a human does slowly and with errors.
Two further difficulties are less obvious but cost more time. Timestamps have low resolution, so many lines share the same wall-clock value and only the nanosecond elapsed counter is usable for measurement. And managed package code is largely invisible: other namespaces log at their own levels, so a package consuming most of your CPU may appear as a handful of opaque lines.
What a debug log analyzer does
An analyzer parses the event stream and rebuilds the structure a human actually needs:
- Execution tree: the nested call hierarchy of code units, so you see what called what.
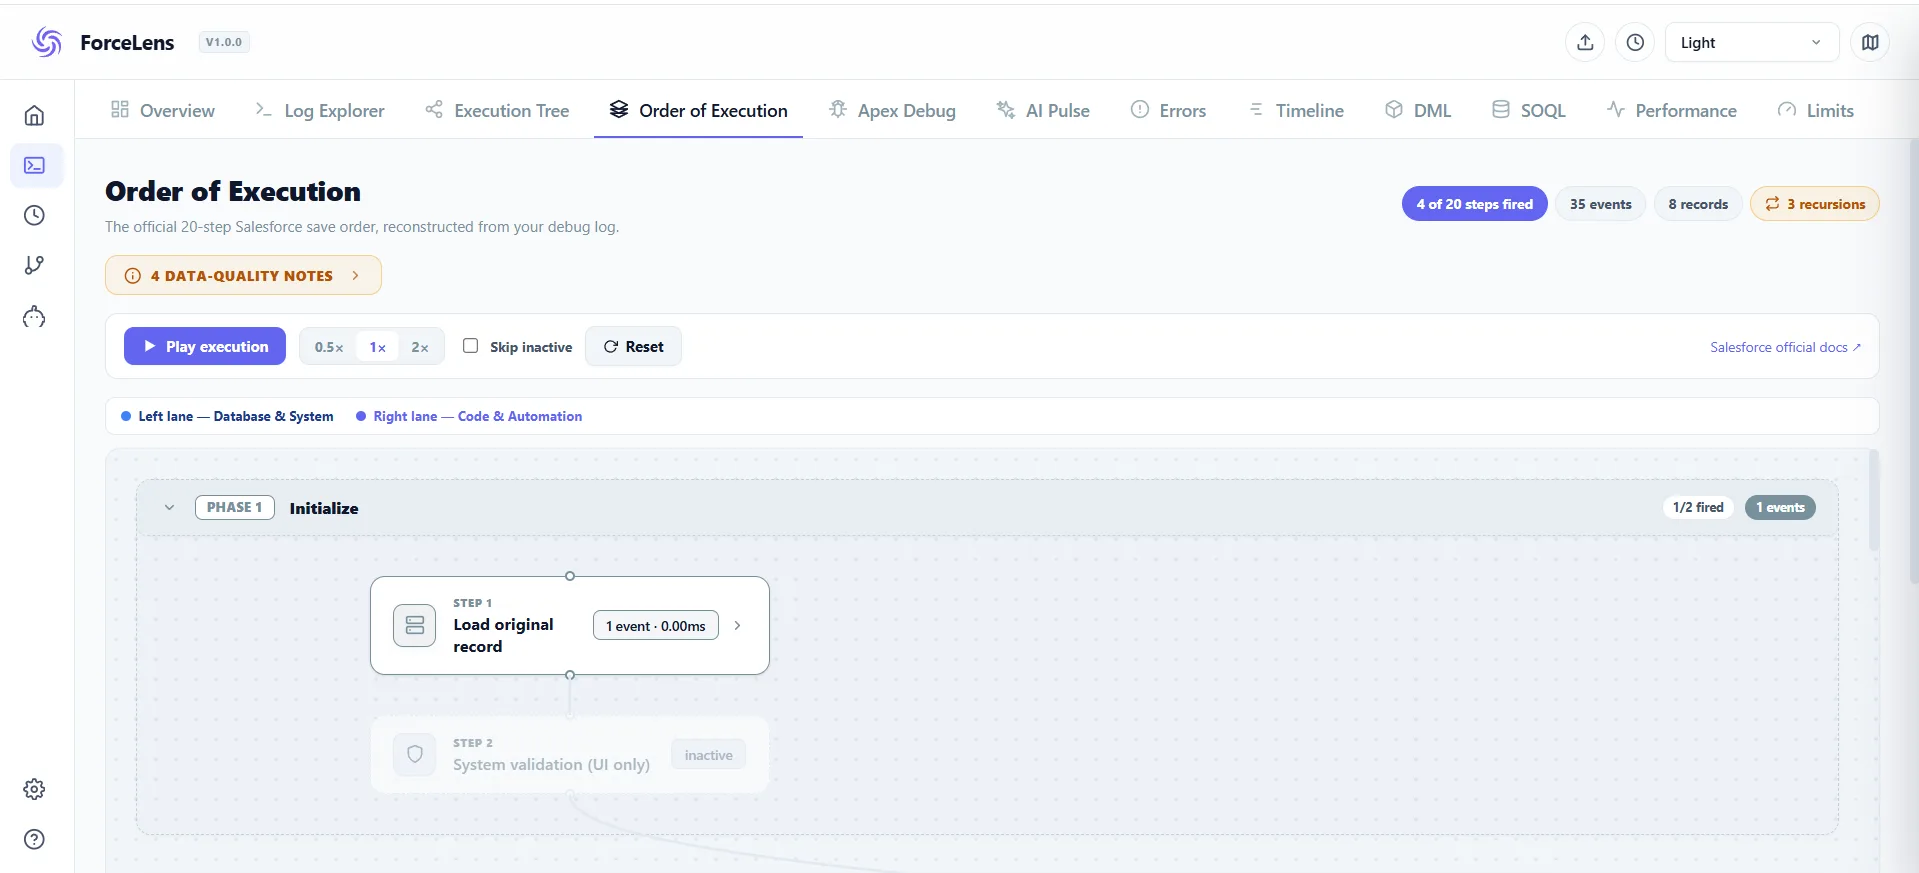
- Order of execution: before/after triggers, validation rules, flows, and workflow in the sequence Salesforce actually ran them. This is ForceLens's signature view, the same diagram architects draw on whiteboards, generated from your real log.
- SOQL & DML analysis: every query and DML statement, aggregated, with row counts (the fastest way to spot queries in loops and non-selective SOQL).
- Performance & CPU breakdown: where the milliseconds went, essential when you're fighting an Apex CPU time limit exceeded error.
- Limits report: governor limit consumption at a glance (see governor limits explained).
- Error surfacing: exceptions and fatal errors pulled to the top with their context, instead of buried at line 48,112.
A note on online log analyzers. Searches for a log analyzer online usually turn up sites that ask you to paste or upload the log file. A debug log routinely contains record ids, field values, user names, query text and sometimes customer data, so uploading one sends production data to a third party. ForceLens is a log parser that runs entirely in the browser: the file never leaves your machine, which also means it works on orgs where sending log data outside the network would not be permitted.
How ForceLens works
ForceLens is a free Chrome extension that runs entirely in your browser. The workflow:
- Capture in one click. Smart Capture creates the trace flag for you, watches for new logs, and opens them analyzed, no Setup ritual. Or click "Inspect Log" beside any existing log in Setup or the Developer Console.
- Parse locally. 100k+ line logs parse in under 100 ms, in your browser. Nothing is uploaded anywhere.
- Analyze through 12 lenses. Overview, Log Explorer, Execution Tree, Order of Execution, Apex Debug, AI Pulse, Errors, Timeline, DML, SOQL, Performance, and Limits.
- Explain with your own AI key (optional). Bring a Claude, GPT, Groq, or OpenRouter key; calls go directly from your browser to that provider.
Which view answers which question
Twelve views sounds like a lot until you map them to questions. In practice you use two or three per investigation:
| View | Answers |
|---|---|
| Overview | Is this transaction healthy, and where is it closest to failing? |
| Errors | What actually ended the transaction, and what was merely caught? |
| Order of Execution | Which automation touched this record, in what sequence? |
| Execution Tree | What called what, and how deep does the nesting go? |
| Limits | Which governor limit is under pressure? |
| SOQL | Which query runs repeatedly, and which returns too many rows? |
| DML | What was written, how many rows, and did it cascade? |
| Performance | Which code unit consumed the most time? |
| Timeline | Where did the transaction's duration physically go? |
| Apex Debug | What did my own System.debug() statements print? |
| Log Explorer | The raw log, filtered and searchable, when you need the source text |
| AI Pulse | A plain-language explanation of what the log shows |
A typical sequence: Overview to see whether limits or an exception caused the failure, then Errors or Limits to confirm, then whichever detail view matches, SOQL for query counts, Performance for CPU, Order of Execution for unexpected field changes. Log Explorer remains available throughout for the raw text, because a good analyzer should never prevent you from reading the underlying log.
A complete investigation, start to finish
Here is the whole workflow on a realistic problem: users report that saving an Opportunity intermittently fails, and the error mentions SOQL queries.
- Capture the right transaction. Trace the user who reproduces it, not yourself, and keep levels moderate:
ApexCode: INFO,Database: INFO,ApexProfiling: INFO. Verbose settings risk truncating the very log you need. - Confirm what failed. Search
FATAL_ERROR. Anything inEXCEPTION_THROWNthat was caught and handled is noise; only the fatal error ended the transaction. - Check the cost. Read
LIMIT_USAGE_FOR_NS. Ninety-eight queries against a hundred confirms the diagnosis; low CPU and heap rule out the alternatives in one glance. - Find the repetition. Look for the same query text at the same line number appearing dozens of times. That line is inside a loop, wherever the loop happens to live.
- Check for recursion first. Before touching the query, scan
CODE_UNIT_STARTEDfor the same trigger appearing more than once. If it does, recursion is multiplying every query beneath it, and fixing that may resolve the count without any query changes. - Read the stack trace bottom-up. The trace names the entry point last and the failing line first. The loop is usually in a caller, so the fix rarely belongs at the line that threw.
- Verify after the fix. Capture a second log and compare the limit summary. A change that moves queries from 98 to 12 is confirmed; one that moves them to 94 has not solved the problem.
Step 7 is the one most often skipped, and the reason problems recur. A transaction sitting close to a limit will fail again as soon as data grows or another automation is added, so aim for half the budget, not just below the cap.
What log analysis cannot tell you
An analyzer makes a log readable. It does not make the log contain more than it does, and knowing the boundaries saves you from chasing answers that were never in the file.
Anything the log levels did not capture. If Workflow was low, your flows are absent, and their absence looks identical to them never having run. Before concluding something did not execute, confirm the relevant category was high enough. This is the single most common false conclusion in log debugging.
Anything after truncation. A log that hit the 20 MB cap has lines removed from the middle. Always check for skip markers before treating a missing event as meaningful.
Work in other transactions. Async jobs, batch chunks and platform event handlers each write their own log at their own time. A synchronous log ending cleanly tells you nothing about whether the queued work later succeeded.
Managed package internals. You can see that a package consumed time and limits, but usually not what it did. When a package dominates a transaction, the productive route is its own configuration and its vendor, not deeper log analysis.
Variable state you did not log. Even at FINEST, the log shows assignments rather than a full memory picture. For genuine step-through inspection of variable values, the Apex Replay Debugger is the right tool — see the comparison below.
Why the data was wrong to begin with. A log explains what the code did with the input it received. If the input itself was wrong, the answer lies upstream in an integration, a data load, or a user action that a different transaction's log would show.
ForceLens vs. built-in Salesforce tools
| Developer Console | Apex Replay Debugger (VS Code) | ForceLens | |
|---|---|---|---|
| Where it runs | Browser (separate window) | VS Code + SF CLI setup | In your existing Salesforce tab |
| Log capture | Manual trace flags | Manual trace flags | One-click Smart Capture |
| Order of execution view | No | No | Yes, reconstructed per transaction |
| SOQL/DML/limits aggregation | Partial (raw panels) | No | Yes, dedicated tabs |
| Flow analysis | No | No | Yes: log events + Flow Builder lenses |
| AI explanations | No | No | Optional, with your own key |
| Step-through debugging | No | Yes (replay) | No (analysis, not a debugger) |
| Cost | Free | Free | Free |
Two other tools deserve a mention here, because they are the ones people most often weigh against ForceLens.
Apex Log Analyzer, the Certinia VS Code extension, is the stronger tool for pure performance profiling. Its flame chart is the best way to see where time went across a deep call stack, and if you already live in VS Code it is an excellent choice. ForceLens trades that depth of timing detail for running in the Salesforce tab you already have open, and for views the flame chart does not attempt, notably order of execution and Flow analysis.
Salesforce Inspector Reloaded is not really a competitor. It answers "what does this record contain" rather than "what happened during this save", so most developers keep both installed. See Salesforce Developer Console alternatives for a full feature matrix of all of these.
Each tool has a place. The Replay Debugger is genuinely the right choice when you need to step through variable state line by line.
Frequently asked questions
What is a Salesforce debug log analyzer?
A tool that parses raw Apex debug logs and presents them visually: execution tree, timeline, order of execution, SOQL/DML breakdown, and governor limit report. This lets developers find errors and performance problems far faster than reading the log line by line.
Is ForceLens free to use?
Yes. Log capture, parsing, order-of-execution reconstruction, and Flow analysis are all free and run locally. Optional AI explanations use your own API key, so you only ever pay your own AI provider.
Do I need to download my logs to analyze them?
Not with ForceLens. It adds an "Inspect Log" link directly on the Debug Logs list, the log detail page, and inside the Developer Console, and Smart Capture sets the trace flag and opens the captured log automatically.
Does a log analyzer send my Salesforce data to a server?
ForceLens does not. Logs are parsed in your browser and stored only in local browser storage. The only outbound requests are AI calls you explicitly trigger, sent directly to the provider whose API key you configured. Details in the Trust Center.
Can it analyze Flow debug logs too?
Yes. Flow elements appear in debug logs as FLOW_* events, and ForceLens surfaces them in the execution tree and order of execution. It can also analyze a Flow's structure directly from Flow Builder; see Salesforce Flow debugging.
Do I still need to know how to read logs manually?
Yes, and it remains worth learning. An analyzer speeds up work you understand; it cannot tell you which question to ask. Knowing that FATAL_ERROR is the failure and EXCEPTION_THROWN may be routine, or that a repeated line number means a loop, is what makes any tool useful. Our step-by-step guide covers the manual method with no extension required.
Why does my log not contain the event I expected?
Three usual causes: the relevant log category was set too low, so the event was never written; the log exceeded 20 MB and lines were dropped from the middle; or the work happened in a separate asynchronous transaction with its own log. Rule out all three before concluding the code did not run.
Can a log analyzer tell me what a managed package is doing?
Only partly. You can see that a package consumed CPU, queries and DML, because those count against your transaction's shared limits. Its internal logic is not written to your log at any level. When a package dominates a transaction, look at its configuration or raise it with the vendor rather than analysing harder.
Is a log analyzer the same as a debugger?
No, and the difference matters when choosing a tool. An analyzer reconstructs what already happened from a recorded log, which is good for order of execution, limits, and performance. A debugger such as the Apex Replay Debugger lets you step through execution inspecting variable state line by line. Use the analyzer to find where the problem is, and the debugger when you need to see exactly what a variable held.
Try it on your next log
Install ForceLens free, open any debug log in your org, and see the execution instead of reading it. No account, no server, no cost.